Large modern web applications can benefit from being developed in smaller, autonomous pieces owned by different teams, which are later integrated to create a seamless experience for the end user. This practice enhances scalability and autonomy for teams, enabling them to collaborate and create an experience greater than any individual could achieve on its own. But what if you want to measure the performance of the individual components of that application? And even more importantly, how do you monitor the performance of the greater application pages to identify slowdowns and problems before they affect your end users?
For local development, the browser performance API offers a native solution for measuring the duration of performance-critical tasks directly in your browser using marks and measures. This tool is both simple and powerful, providing an intuitive interface for collecting task durations and can even display those durations directly in the developer tools when auditing local page performance. It is supported by every major browser and has been a staple of local web optimization for over a decade. But for complex applications where much of the platform is owned by other teams, understanding pitfalls and slowdowns across the many components of a website can be challenging, especially when there are so many external factors at play. Internet speed, browser compatibility, user location, and page state are just a few of the many variables that can impact your website’s performance. Without being able to aggregate and evaluate metrics across the wider application, it can leave you blind to performance issues.
Measuring render performance at New Relic
Here at New Relic, to monitor and improve performance across our segmented micro-frontend (MFE) applications, we implement a standardized set of marks and measures that apply to our components and platform, providing insights into changes. To do this, we crafted a series of measures aimed at forming a holistic view of web performance across individual components and the entire webpage. Measures are captured for the rendering time of each individual component running in the New Relic platform. These measures focus on capturing the component’s load time and are integrated into their lifecycle hooks, using shared libraries that serve as utilities for each MFE team during development. For example, a shared utility library can be responsible for creating a namespaced “mark” at the time each component is imported or instantiated, and another mark can be set when each component renders for the first time. A curated measure can then be crafted using the two marks, and the duration of the task would be captured by the browser’s performance API.
In addition to the component measures, durations are also captured for the platform’s load time—the portion of the web application responsible for stitching together and rendering the individual components. Finally, measures are also captured representing the organic page timings, irrespective of the platform or component portions of the application. Together, these metrics create a holistic view of performance and provide a series of measurement metrics for future degradation or deviation.
Based on the description above, visualize the following simplified measures that could be captured across the totality of a web application:
- Component total load time (CTLT): A measure observing the total load time of individual components.
- Platform total load time (PTLT): A measure observing the overall loading time of the platform.
- Total load time (TLT): Combines CLT, PLT, and other factors to provide a comprehensive load time measurement.
These measures can be further broken down into sub-measures such as:
- Server load time (SLT): A measure observing the server execution time.
- Platform asset load time (PALT): A measure observing the time it took to load assets by the platform.
- Platform execution time (PET): A measure observing the time callbacks took to fire on the platform.
- Component asset load time (CALT): A measure observing the load time of component assets.
- Component data load time (CDLT): A measure observing the load time of network calls to hydrate the component.
These values are useful locally because they break down timings in your local dev tools and performance profiles. The measures appear directly in your performance profile and can be quickly visualized.
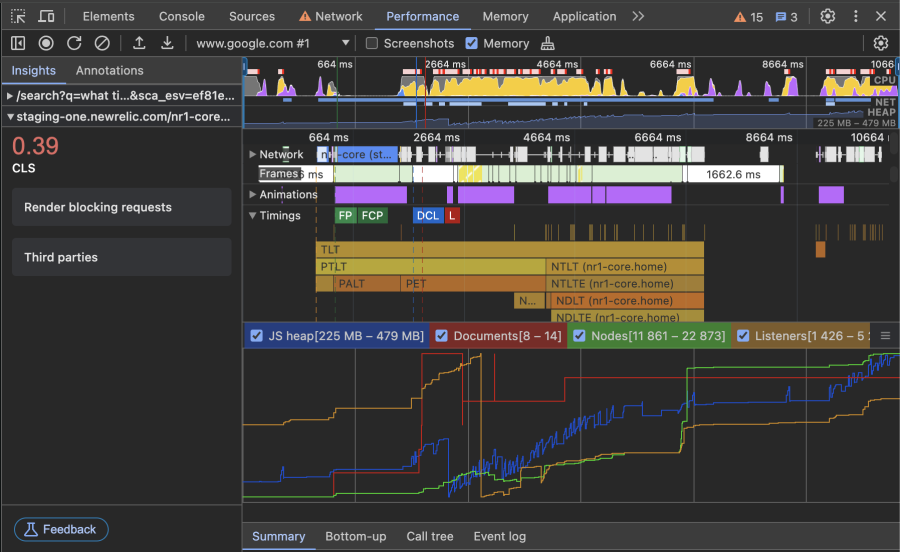
Aggregating these values across all pages and components of your entire web application unlocks new observation potential. Alerts can be crafted if portions of the application show degradation. Individual components can be identified when bottlenecks are observed. When dealing with problems in complex applications or micro-frontend architecture patterns, determining the “what” and “who” often becomes the most important, yet most challenging questions to answer. How can you compile all the measurements from every page and component into a single dataset?
Introducing our new data collection integration: New Relic BrowserPerformance events
The browser agent’s new data collection integration is designed to automatically collect native performance marks and measures out of the box. This tool detects when marks or measures are added to the performance API and creates new events for each item, which are known as "BrowserPerformance" events. These events capture the basic API information, custom attributes, and page identifiers—automatically. Simply use the performance measure API as you normally would, and the New Relic browser agent will automatically collect your marks and measures across your application ecosystem for a more holistic interpretation using the New Relic platform.
Why is this important?
By automatically collecting and analyzing performance metrics, our tool enables teams to pinpoint the exact timings associated with each component, page, team, and release. This is particularly useful for identifying which teams own the relevant timings and understanding how each component contributes to the overall performance of the application.
For example, if your app records measures similar to CTLT, PTLT, and TLT, New Relic will automatically collect these values and harvest them. This means that such durations can be evaluated across the entire application, providing powerful insights for optimization and performance analysis. Teams can see how their components perform in real-world scenarios and make data-driven decisions to enhance their code. Set alerts and monitor dashboards to catch problems before they reach customers and celebrate performance gains with data-driven confidence.

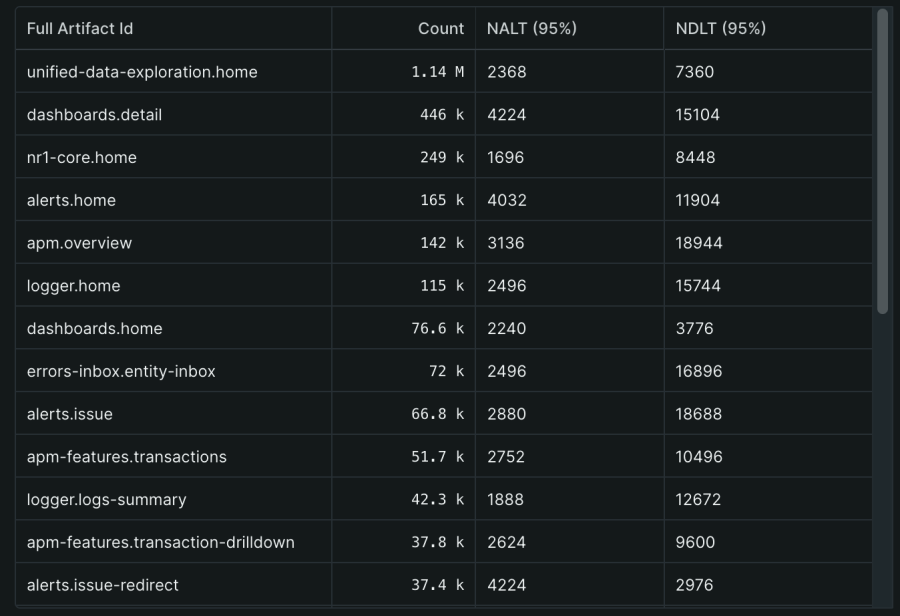
The use cases for performance measures extend far beyond the implementation described here. Any complex task that you care about measuring the duration of can be easily represented by using the performance API. With the New Relic browser agent, you can aggregate all measures in one place to analyze holistic performance.
With New Relic BrowserPerformance events, you can ensure that each task you care about is optimized and that the overall application meets performance to expectations, even in complex architecture patterns. By identifying the specific timings and understanding the ownership of each task, you can address performance bottlenecks more effectively and improve collaboration among teams.
How to get started with collecting browser marks and measures
Install and configure
To use the New Relic browser agent to capture marks and measures, you’ll need to follow some steps to install and configure it properly. Here’s a guide on how to do that.
- Open New Relic and then select Add Data from the navigation panel.
- Select Browser & Mobile, then select the Browser monitoring data source.
- Choose your deployment method, either APM or Copy/Paste.
- Select an existing app monitored in APM, or name your new app and then click Enable.
You can also utilize the browser agent NPM package to instrument your webpage. For more information about that process, see this instrumentation guide. Manually capturing browser logs is supported in browser agent versions 1.261.0 and higher.
Enable marks and measures detection
To get started collecting marks and/or measures during its limited preview run, see our docs.
Find your data in New Relic
Once enabled, the agent stores marks and measures data under the BrowserPerformance event type in New Relic. BrowserPerformance events will capture everything available in the API; the duration, name, and even any custom details assigned to the value. Custom attributes assigned to your browser agent will also be captured with every BrowserPerformance event. Finally, page identifiers like the session, trace ID, user ID, and page URLs will also be recorded to help enhance the holistic view of the captured data. To find this data, try the following query and then create custom dashboards to track performance.
This simple New Relic Language Query (NRQL) query retrieves all BrowserPerformance events for the specified appName ("My Application") where the entryName is either mark or measure.
FROM BrowserPerformance SELECT * WHERE appName = 'My Application' AND entryName = 'mark' OR entryName = 'measure'Install the browser agent and start optimizing your complex web applications today. Happy coding!
Next steps
By utilizing the browser performance APIs, you can successfully integrate your browser performance metrics into New Relic to optimize your application. Install the browser agent today to see your performance API data in one place with the New Relic Browser Agent today.
The views expressed on this blog are those of the author and do not necessarily reflect the views of New Relic. Any solutions offered by the author are environment-specific and not part of the commercial solutions or support offered by New Relic. Please join us exclusively at the Explorers Hub (discuss.newrelic.com) for questions and support related to this blog post. This blog may contain links to content on third-party sites. By providing such links, New Relic does not adopt, guarantee, approve or endorse the information, views or products available on such sites.

