Introducing Logs Intelligence
The next evolution in log analysis
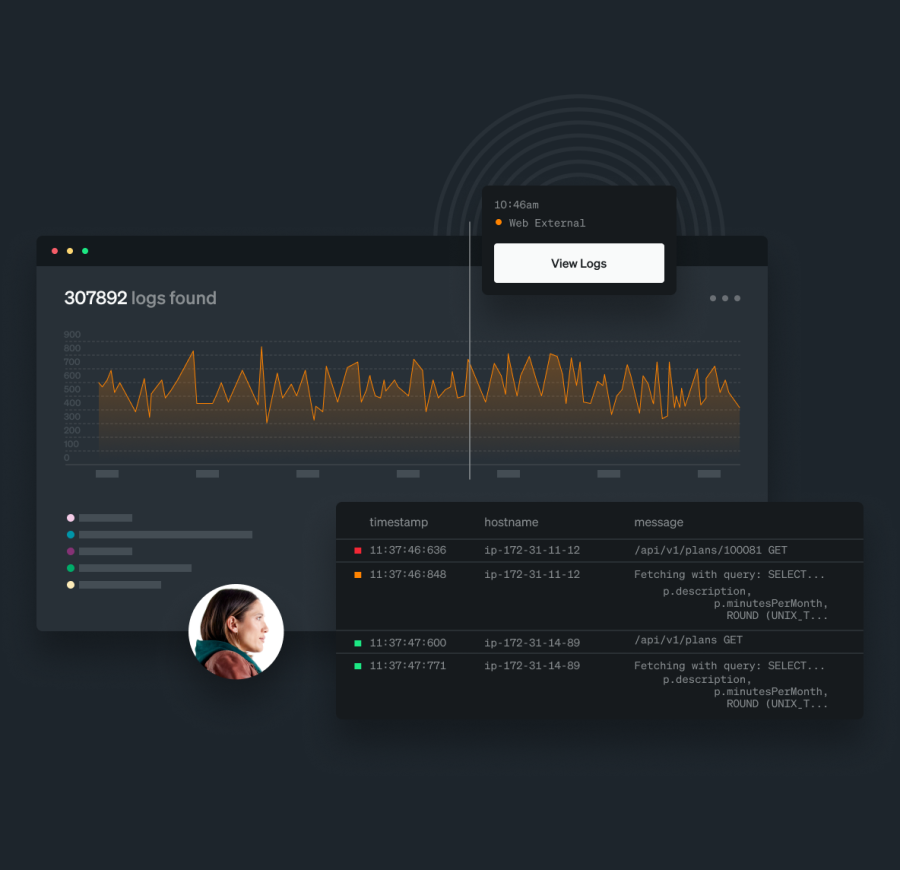
AI LOG ALERT SUMARIZATION
Pinpoint root causes in one click
- Pinpoint root causes swiftly using AI-driven insights for faster resolution
- Resolve incidents effectively with JOINs and lookups, streamlining complex queries
- Dive into log data effortlessly; volumes of logs analyzed with a single click
- Gain clear data summaries that enhance understanding and speed up issue resolution

NO-CODE PARSING
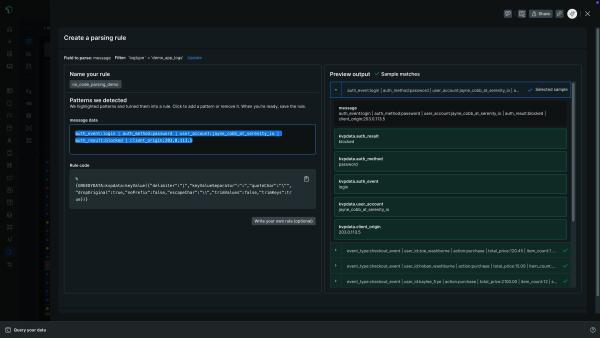
Structure logs instantly, no code required
- Process unstructured logs faster with a visual interface without needing specialized regex skills or complex code
- Automatically detect formats like JSON and CSV to generate performant parsing rules instantly
- Validate rules with instant previews against real log samples before you save
- Launch parsing rules directly from the Log Detail view with no interruption to your investigation flow
UNIVERSAL DATA INGESTION
Simple to set up, easy to use
- Ingest log data easily from anywhere using New Relic log forwarder
- Configure APM and infrastructure agents to get in-context logs alongside other telemetry data
- Use open source tools from Fluentd, Fluent Bit, and Logstash, and integrations with AWS, Azure, and more
- Go agentless and forward syslog data to New Relic TCP endpoint

FEDERATED LOGS
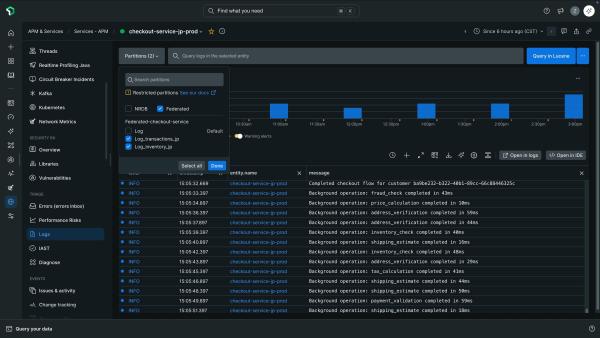
Analyze logs at their source
- Process and query logs directly in S3 buckets without custom schemas or re-ingestion
- Unify siloed storage with live telemetry in a single view for complete context across your stack
- Keep sensitive logs local to satisfy strict data residency and compliance mandates
LIVE ARCHIVES
Eliminate cold storage hassles with compliance queries at 1/4 the cost of others
- Analyze compliance logs swiftly for rapid insights with your other logs
- Avoid rehydrating, reloading, re-indexing, or moving data across tiers
- Forget charges for data handling, formatting, or extra log tools
- Store logs for up to seven years, fully active and enriched

See why customers love New Relic log management.
Look who
has us open.
has us open.
1
