New Relic versus Dynatrace. See inside your entire stack in just a few clicks.

Feature New Relic Dynatrace
APM and Infrastructure Monitoring for understanding system health at-a-glance. ✔️ ✔️
Easily integrates with all major cloud providers, frameworks, and technologies. ✔️ ✔️
Automatic root cause detection and correlated alerts, with 95% less noise. ✔️  
Ingest all telemetry data into rich visualizations and dashboards so you can easily find the bug that’s bugging you. ✔️  
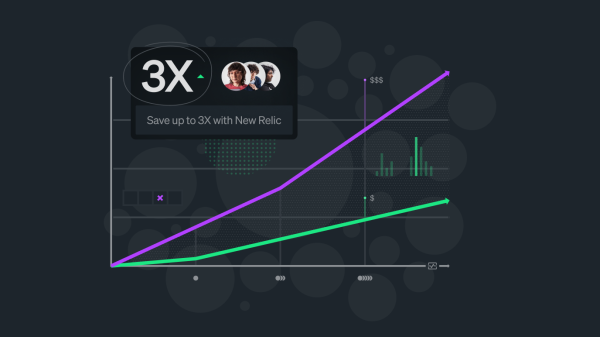
Predictable pricing for all your metrics, events, logs, and traces at $0.35/GB. ✔️  
Faster MTTR with contextual troubleshooting across all data types. ✔️  
100GB of data free every month for all pricing plans (unlimited dashboards, queries, and alerts). ✔️  


Need a single view with simple pricing? We’ve got you.

  • All of the advanced full-stack analysis tools you need at one price per user.
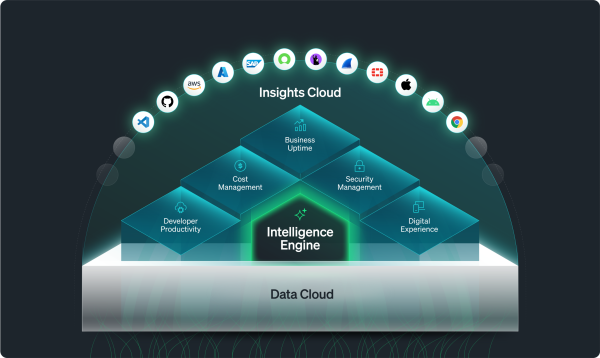
  • Eliminate blind spots with the only unified data layer for all metrics, events, logs and traces.
  • Collect any data from any source at any scale using agents, open standards, APIs and an ecosystem of 750+ integrations. All in a FedRamp and HIPAA compliant solution.
  • Get integrated, contextual workflows to help you identify root cause and resolve issues faster.
  • No more sampling, counting agents, creating custom metrics, or worrying about hidden fees. Pay a single, low price based on data volume irrespective of data source.

Customers love New Relic

Get full access to New Relic One for free

Monitor your stack for free with full platform access and 100GB of ingest per month. No credit card required.