New Relic Now Dream of innovating more? Start living the dream in October.
RSVP Now

Java

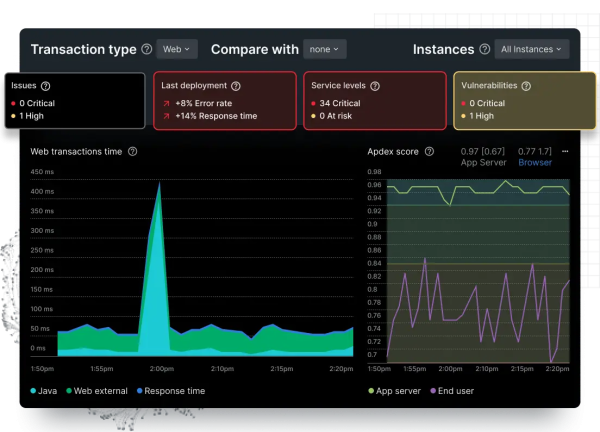
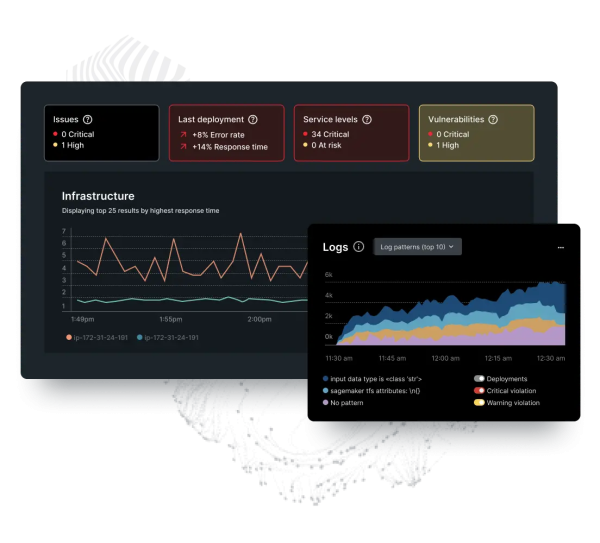
The New Relic Quickstart for Java provides insight into application performance, improves uptime, and reduces latency. Monitoring is reported using metric time-slice and event data, and all results are displayed in easy-to-use, visual dashboards.

What's included?

dashboards
1
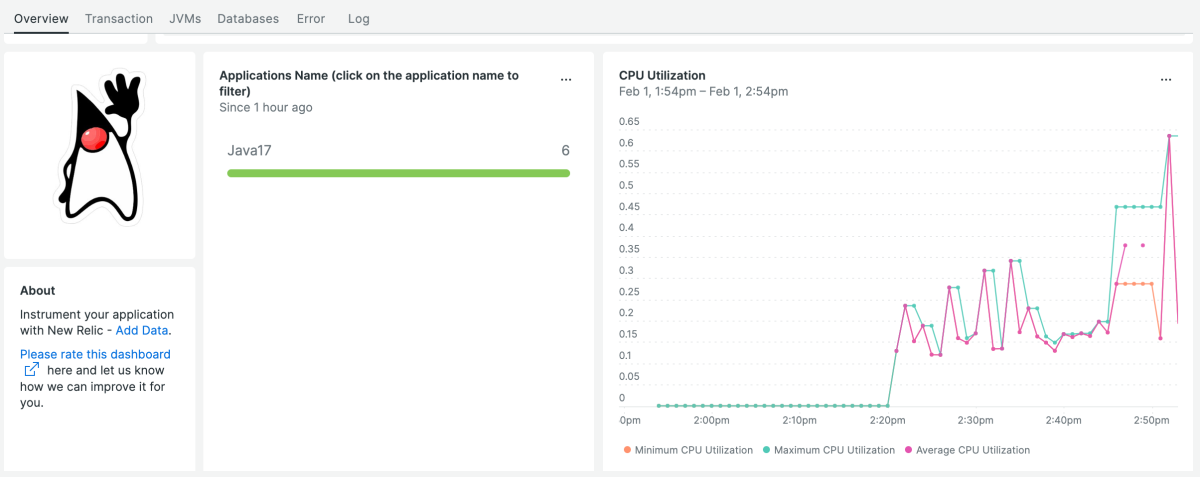
Java quickstart contains 1 dashboard. These interactive visualizations let you easily explore your data, understand context, and resolve problems faster.
alerts
4
Java observability quickstart contains 4 alerts. These alerts detect changes in key performance metrics. Integrate these alerts with your favorite tools (like Slack, PagerDuty, etc.) and New Relic will let you know when something needs your attention.
Transaction Errors
This alert is triggered when the transaction error count is higher than 5 for 5 minutes.
High CPU Utilization
This alert is triggered when the CPU Utilization is above 90%.
Average Transaction Duration
This alert is triggered when Average Transaction Duration is higher than 2 seconds for 5 minutes.
Average Heap Memory Used
This alert is triggered when Average Heap Memory Used is higher than 2048 MB for 5 minutes.
documentation
1
Java observability quickstart contains 1 documentation reference. This is how you'll get your data into New Relic.

Why monitoring Java is so important

Java is a compiled language, with the potential to be very fast. However, there are a a lot of Java-specific quirks that make the average program slow such as high default memory usage and lags in the startup time of the JVM.

In order to get the most performance out of your Java applications, it’s important to continuously monitor them with tools such as the New Relic Java agent.

New Relic Java quickstart features

  • Dashboards showing average CPU utilization, memory heap used, garbage collection CPU time, top 5 slowest transactions, and more.
  • Alerts for various metrics including high cpu utilization and transaction errors

New Relic - the perfect Java observability tool

Proactive Java monitoring yields reductions in site latency and improves the user experience. Our Java agent monitors app servers, databases, and message queuing systems, giving insight into all the key components which allow a web app to run. Custom instrumentation is also available for the add-on Java frameworks and libraries which may be used.

The agent reports metric time-slice and event data, giving insight at scheduled intervals. It also provides JVM-level observability, providing thread pools data, HTTP sessions, and transactions. You can trace request flows through distributed systems, allowing you to pinpoint points of failure and proactively prevent downtime. All metrics and interfaces are unified via an included dashboard which provides a visual display of an application’s performance.

Further leverage New Relic's APM capabilities by setting up errors inbox, transaction tracing, and service maps.

How to use this quickstart

  • Sign Up for a free New Relic account or Log In to your existing account.
  • Click the install button.
  • Install the quickstart to get started or improve how you monitor your environment. They're filled with pre-built resources like dashboards, instrumentation, and alerts.