DATA DISCOVERY AND ANALYSIS
Simplified querying of entities, telemetry, and business data
Unify data for deep context and meaning
- Stream and track events and their sources from across your stack
- Instantly share insights beyond New Relic users, including business leaders, non-technical teams, and even customers
- Add external data from Snowflake, Google Sheets, Fluentd, OpenTelemetry, Prometheus, Zipkin, and more
- Create custom attributes and event types to monitor for issues in your unique business context
- Link entities, traces, and logs to find root causes and understand data relationships
Explore your data at a glance
- Use New Relic Lens to query multiple external data sources without ingesting the data they contain
- Your New Relic Homepage is personalized with the real-time health and performance data most relevant to you
- Quickly slice and dice relevant data into one view with the world’s most powerful telemetry database
- Analyze more than 50 billion events with a lightning-fast median response time of 60 ms per query
- Instantly get the data you need by simply plugging a value into a template variable in your dashboard widget query
Collaborate and share insights
- Share investigations, research, and post-mortems using dynamic runbooks created in Notebooks
- Easily create and share dashboards using a single database and query language
- Utilize built-in security controls to determine who can create, manage, and revoke links
- Invite others to your dashboards simply by copying and sharing a permalink
Go from complex searches to easy answers
- Access critical apps, services, and hosts from your personalized Homepage
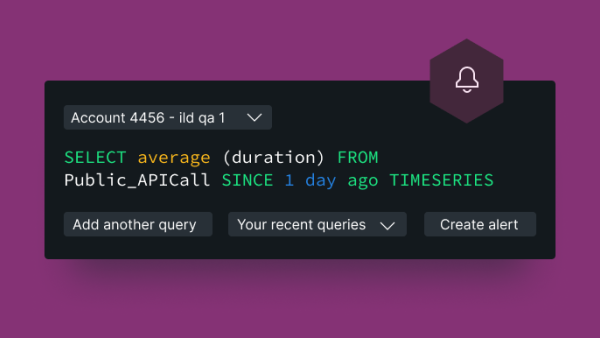
- Explore, filter, and add searches in a click with New Relic Query Language (NRQL) or data explorer
- View data in context with easy-to-use tools, including brush and zoom, chart scrubber, and more
- Instantly recognize which values are important to filter with the variables filter bar and template variables
Take more control and increase efficiency
- Take advantage of automation with dashboards as code with the New Relic provider for Terraform
- Easily create, configure, and export dashboards with the NerdGraph API
- Create dashboard templates using template variables that pull from a query-generated list of values
Look who
has us open.
has us open.
1
2
3
4

