Dojo

Monitor your Dojo application by tracking performance issues with a full end-to-end view of distributed traces.

What's included?

dashboards
1
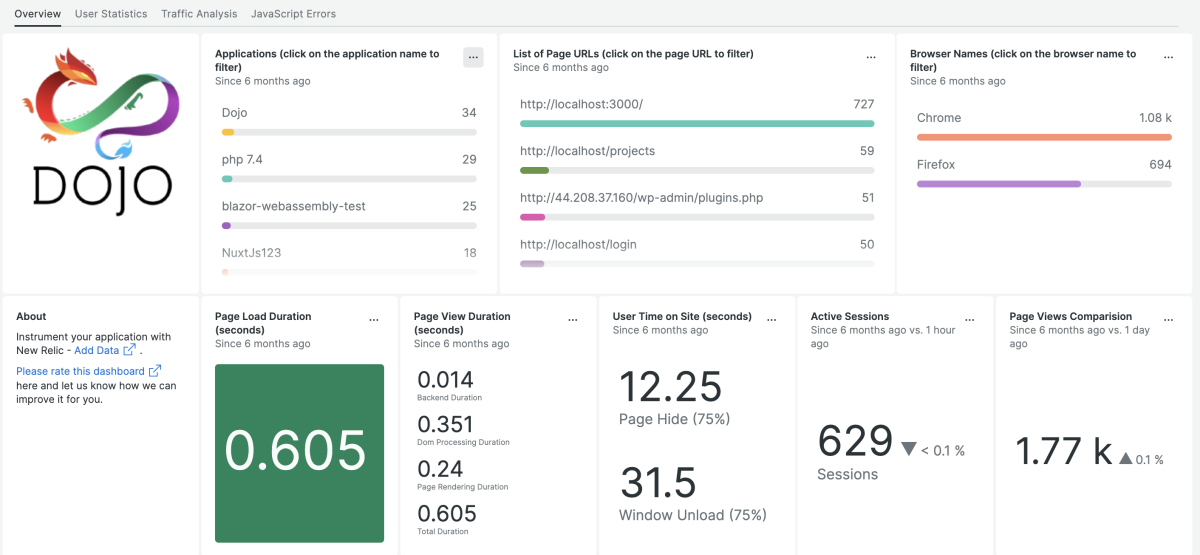
Dojo quickstart contains 1 dashboard. These interactive visualizations let you easily explore your data, understand context, and resolve problems faster.
alerts
3
Dojo observability quickstart contains 3 alerts. These alerts detect changes in key performance metrics. Integrate these alerts with your favorite tools (like Slack, PagerDuty, etc.) and New Relic will let you know when something needs your attention.
Page Load Time
This alert is triggered when the page load time is higher than 5 seconds for 5 minutes.
Ajax Error Response
This alert is triggered when the client and server error response is higher than 10 for 5 minutes.
Application Error Rate
This alert is triggered when the Application Error Rate are higher than 5 for 5 minutes.
documentation
1
Dojo observability quickstart contains 1 documentation reference. This is how you'll get your data into New Relic.

Comprehensive monitoring quickstart for Dojo

Transform the performance of your Dojo application with complete observability, even in the face of complicated and distributed environments. Deliver an unparalleled user experience by identifying and swiftly resolving performance issues, all without sacrificing any aspect of your user experience.

Why monitor your Dojo app?

Performance

Recognize bottlenecks and potential issues, and take proactive steps to resolve them before they impact the user experience. Identify and address any security vulnerabilities in a timely manner, helping to keep your application and user data safe.

Compatibility

Stay informed about changes to browser compatibility and ensure that your application continues to work seamlessly across different platforms and devices.

User experience

Monitoring the framework can help you identify areas for improvement in your application's user experience and make informed decisions about how to optimize it for your users.

Debugging

Catch and resolve issues during development and testing, allowing you to identify and fix problems before they reach production.

How to use this quickstart

  • Sign Up for a free New Relic account or Log In to your existing account.
  • Click the install button.
  • Install the quickstart to get started or improve how you monitor your environment. They're filled with pre-built resources like dashboards, instrumentation, and alerts.
Authors
New Relic
Support
BUILT BY NEW RELIC
Need help? Visit our Support Center or check out our community forum, the Explorers Hub.