Image
Quickstart
What is OpsLevel?
A developer portal for high-performing engineering teams. Give your engineering team one place to fix, build, and release high-quality code without operational toil. Improve speed and standards with the OpsLevel developer portal.
OpsLevel quickstart highlights
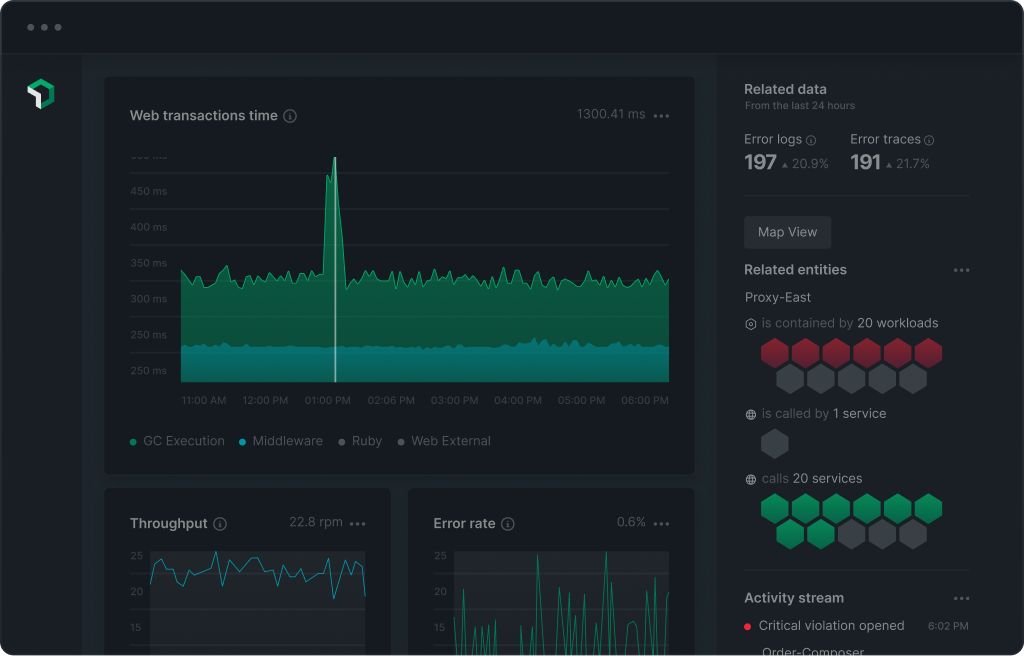
Integrate New Relic with OpsLevel to bring New Relic alert statuses into your OpsLevel developer portal.
With New Relic in OpsLevel you can:
- Set yourself up to avoid incidents, performance issues, or gaps in your observability data streams
- Give your team real-time visibility of production status across your software ecosystem
- Keep your team informed of alerts and notify the correct people to help resolve them
Get started!
Check out our Integration Guide to learn more about connecting New Relic and OpsLevel.
New to OpsLevel? Try OpsLevel for free.
Authors
Support
BUILT BY COMMUNITY
Need help? Visit our Support Center or check out our community forum, the Explorers Hub.
Need help? Visit our Support Center or check out our community forum, the Explorers Hub.
Related resources