When it comes to software, observability is about understanding the current state of your system based on its external outputs. However, it can be challenging to track these outputs, especially with complex systems and distributed microservices.
That’s why your observability solution needs to be as flexible as possible when it comes to receiving data. Whether that’s code-level instrumentation, an API, or even a custom code solution, the goal is to process all of your telemetry data so you have a comprehensive view of what’s going on in your system. Ultimately, your observability solution is only as useful as the data it gets.
Here are twenty ways you can send telemetry data to New Relic One, ensuring that you get complete observability of your system. Watch the video or read on to learn more.
1. APM agent
Application performance monitoring is a key part of observability. New Relic One’s APM supports code-level instrumentation with quick setup for multiple programming languages, including Go, Java, .NET, Node.js, PHP, Python, Ruby, and a C SDK. Read more about APM and instrumentation in the APM documentation. If you’re just getting started with observability, learn about application performance monitoring.
2. Browser agent
New Relic browser monitoring is the world’s most deployed real-user monitoring (RUM) solution, but there’s a lot you can monitor besides RUM, including actual and perceived performance data, JavaScript error analytics, session performance, AJAX requests, and more. You can set up browser monitoring simply by adding a JavaScript code snippet or automatically via APM. Learn more about browser monitoring.
3. Mobile agent
Over 90% of global internet users use mobile devices to go online, so mobile monitoring is absolutely essential. With New Relic One’s mobile monitoring, you can see how your mobile applications are performing in one dashboard, including information on crashes, response time, and HTTP errors. For more information on setting up mobile agents, see the mobile monitoring documentation.
4. Infrastructure agent
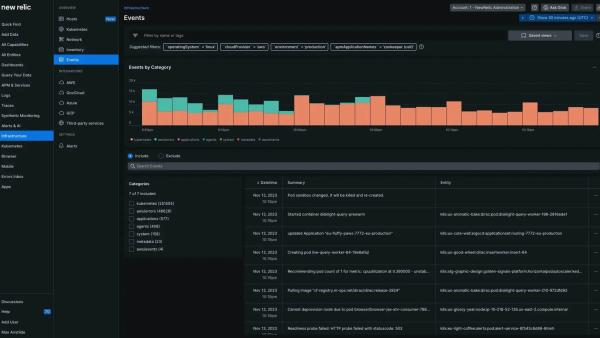
New Relic’s infrastructure monitoring agent is a lightweight executable file that collects data about your hosts and acts as a forwarder for logs and core service metrics. It can run on MacOS, Windows, and many Linux distributions. You can use the guided install or deploy the agent programmatically with Chef, Puppet, Docker, and others.
5. Kubernetes agent
New Relic One uses Pixie to provide Kubernetes observability, including the Kubenetes cluster explorer, which gives you a high-level view of your clusters and how they are performing. You can use an automated installer to generate a manifest or use Auto-telemetry with Pixie, which doesn’t require a language agent.
6. On-host integrations
New Relic Instant Observability (I/O) offers on-host integrations so you can send data from many popular services and products such as Apache, Kafka, and Redis to New Relic One.
7. Cloud integrations
New Relic One provides monitoring for all major cloud providers, including Amazon Web Services, Google Cloud Platform, and Microsoft Azure. Preparing to migrate to the cloud? Read this 10-step cloud migration checklist.
8. OpenTelemetry
OpenTelemetry is an open source, vendor-neutral collection of tools, APIs, and SDKs for working with telemetry data such as metrics, logs, and traces. You can use New Relic One to instrument your services with OpenTelemetry.
9. Metric API
The Metric API can be used to send metric data to New Relic from a wide range of sources. No agent is needed, and you have full control over the data you are sending to New Relic. The Metric API gives you a lot of flexibility—read on to see how a New Relic engineer used the Metric API to monitor his home solar array.
10. Prometheus
Prometheus is a powerful, open source tool for real-time monitoring of applications, microservices, and networks. It’s especially useful for monitoring Kubernetes clusters. You can integrate Prometheus with New Relic One and even use PromQL-style queries in New Relic One.
11. Event API
Use New Relic’s Event API to report custom event data to New Relic One with a POST request.
12. Trace API
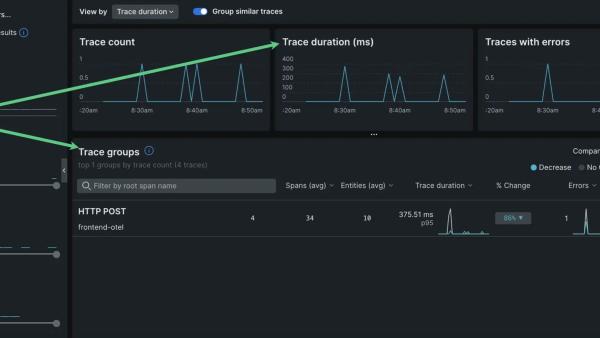
New Relic’s Trace API allows you to send distributed tracing data to New Relic One using either New Relic's generic format or the Zipkin format.
13. Edge with Infinite Tracing
New Relic Edge with Infinite Tracing is a cloud-based solution that analyzes your trace data and then makes sampling decisions for you and then chooses the most actionable data so you can quickly find and solve issues. Learn how to set up a trace observer to enable Infinite Tracing.
14. Log forwarding
You can use log forwarders to collect logs from elsewhere and enrich their metadata before forwarding them on to New Relic. New Relic includes integrations for many log monitoring and management tools including AWS, Fluentd and Fluent Bit, and Kubernetes, among others.
15. Log API
If you need more than log forwarding, you can use the Log API to send log data with an HTTP request.
16. Serverless logs and metrics
Using AWS Lambda with serverless functions? Learn how to monitor your AWS Lambda functions with New Relic One.
17. Build your own integration with New Relic Flex
New Relic Flex is a lightweight, application-agnostic toolkit that allows you to collect metric data from many different services. All you need is a simple YAML config file.
18. Telemetry SDKs
You can report custom telemetry data to New Relic with this open source set of API client libraries. These SDKs rely on New Relic’s Metric API, Trace API, Log API, and Event API.
To learn more about APIs, take a step into learning about API overload.
19. Observability as code
You may have heard of infrastructure-as-code, which allows you to build, change, and version infrastructure, but have you ever worked with observability-as-code, which does the same for observability? You can use Terraform with New Relic One to provision your infrastructure and services, including New Relic dashboards and alerts.
20. Proactive anomaly detection
With New Relic applied intelligence, you get proactive anomaly detection, which is enabled by default and requires no additional setup. New Relic One uses machine learning to analyze your data and surface anomalies.
Next steps
Are you looking for comprehensive observability for your systems? Sign up for New Relic One. Your free account includes 100 GB/month of free data ingest, one free full-access user, and unlimited free basic users.
Lastly, take a quick look into how we've helped ZenHub achieve success through our Infrastructure monitoring.
The views expressed on this blog are those of the author and do not necessarily reflect the views of New Relic. Any solutions offered by the author are environment-specific and not part of the commercial solutions or support offered by New Relic. Please join us exclusively at the Explorers Hub (discuss.newrelic.com) for questions and support related to this blog post. This blog may contain links to content on third-party sites. By providing such links, New Relic does not adopt, guarantee, approve or endorse the information, views or products available on such sites.


