APIs are an increasingly popular way for businesses to interact with customers and partners without having to build specific features for every interaction. However, as more and more customers take advantage of these APIs, companies are being forced to grapple with how to appropriately limit API usage to prevent intentional or inadvertent overloading.
This post addresses some of the ways New Relic deals with the issue internally, and offers a deep dive into how we dealt with a particularly puzzling API usage issue. We hope it provides insight into how you can deal with API overuse in your own shop. (Yes, it’s long, but there are pictures! You should at least look at the pictures!)

New Relic’s API approach
We originally introduced the New Relic REST API to help our customers access data directly from our products. Since then we’ve made a lot of progress in protecting ourselves from overloading of all our APIs.
Specifically, we have developed a number of techniques to limit resource usage and to mitigate the effects of API overloading (note that the techniques discussed here do not apply to the ingest pipeline through which we receive data from our customers).
For example, we separated the pool of hardware for the New Relic APM API from that of its UI. APM uses the Unicorn web server, which spawns a number of worker processes, each of which can handle exactly one request at a time. This simple ‘one request per process at a time’ concurrency model isn’t new or fancy, but it is tried and true, and offers some important benefits, including strong fault isolation (failures or crashes in one worker process are guaranteed to be scoped to only that process).
Unicorn is completely single-threaded; a single process pulls a request from a socket, generates a response, writes it back to the socket, and then waits for the next request to arrive. So, to be able to process N requests concurrently, we need to run at least N Unicorn worker processes.
To serve static files without tying up a Unicorn worker, we use nginx as a reverse proxy in front of Unicorn. So the normal flow for requests looks like this:
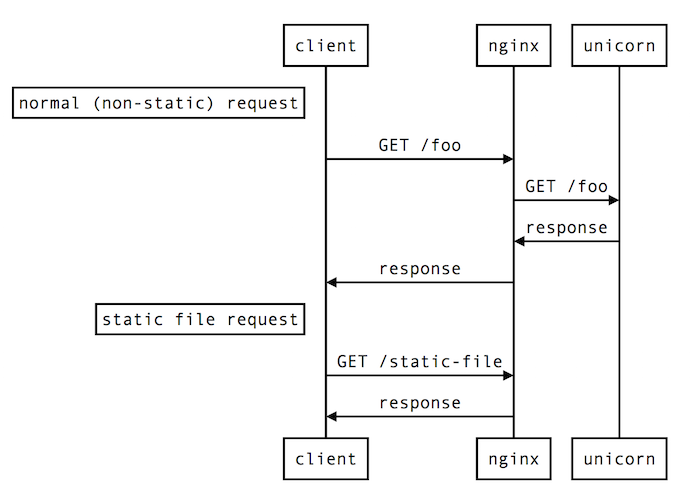

With this approach, the specific thing that prevents API users from consuming all available worker time is that API requests are served by a dedicated pool of hardware resources, meaning that we always have reserved capacity for UI requests.
Of course, no system is foolproof, so let’s refocus on the separation of API/UI worker pools. Despite the separation of API and UI traffic, a heavy API user can still break the UI by impacting shared downstream dependencies. Here’s a slightly expanded version of what a single API request might look like:
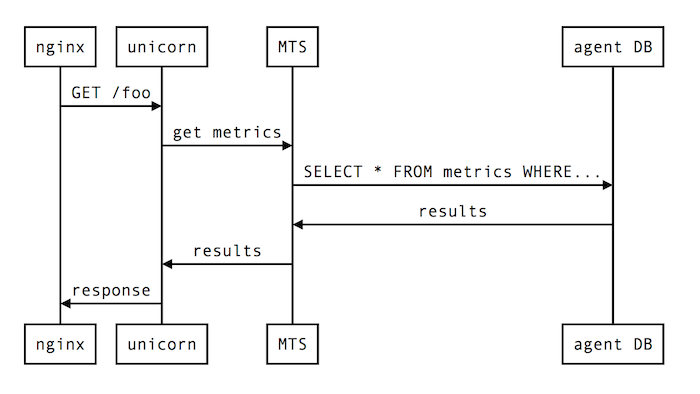
Both the API hosts and the UI hosts rely on our Metric Timeslice Service, which provides access to timeslice data for consumption across all New Relic products (MTS also has its own techniques to prevent overloads). This means that if a single API user can send MTS queries that are expensive enough via API, it can impact MTS, and thus all of MTS’ consumers, including APM’s UI.
That’s why we created API Overload Protection.
This is an internal, resource-limiting tool we built to keep track of Unicorn worker time used per API key. If that time becomes excessive, the tool will automatically restrict that API key for a period of time.
We designed API Overload Protection to operate without the cooperation of the application to which it controls access, in order to guard against malfunctions of the application. This means it ultimately gets timing measurements from nginx.
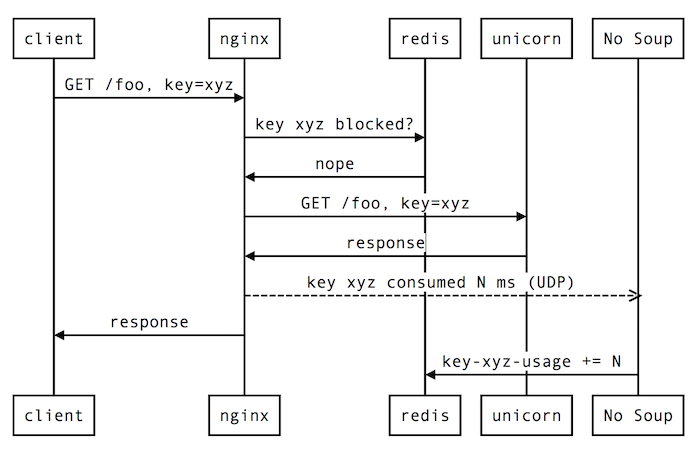
The rough sequence goes something like this:
- Request from client arrives at nginx.
- Some Lua code running in the nginx process (called the “bouncer”) consults a Redis database to see whether the API key associated with the request has exceeded its worker time budget. If so, the request is terminated; if not, it continues.
- Nginx passes the request along to Unicorn, which generates a response and sends it back.
- Nginx notes the amount of time that Unicorn (referred to as the “upstream” server in nginx parlance) took to generate the response and records it by sending a specially formatted UDP packet to the API Overload Protection Tool.
- Nginx sends the response back to the client.
- At some point later, the tool updates its internal counter that tracks the total amount of worker time consumed by the API key in question.
Here’s how that all looks in diagram form:
Investigating a mystery from our case files
This approach has worked well for New Relic, enabling us to satisfy our customers’ needs and improve our overall API use. But edge cases still inevitably cause issues. While every case is different, we’d like to share an internal investigation of one such situation in hopes it can help other companies track down their own API overloading issues.
While investigating a recent case where it seemed like the API Overload Protection should have cut off API access for a customer but did not, we noticed a strange discrepancy: New Relic Insights transaction data from the New Relic APM API indicated that the customer had used far more than its allotment before being blocked. The difference was stark during a particular one-hour period: the tool believed the API key had used only a reasonable amount of Unicorn worker time, but the Insights transaction data indicated that the total had been much, much longer! If the tool had been getting accurate information about the API key’s usage, it would have been able to reduce the duration of the impact by more than 700%!
Because we had seen similar discrepancies in past incidents, we decided to investigate.
Faced with a discrepancy between Insights transaction data and the tool’s internal accounting, we looked for a tie-breaker: the nginx access logs. In our nginx access logs, we record several relevant attributes about each request:
- The client-facing response time (the elapsed time between when nginx first saw the request and when it wrote a response to the client)
- The client-facing response code (e.g., 200, 404)
- The upstream response time (how much time nginx spent waiting for Unicorn to return a response)
- The upstream response code (the response code that Unicorn handed back to nginx)
Using some clunky heuristics, such as examining request timestamps and URLs, we were able to match request records from the nginx access logs of one particular host to the corresponding transaction events that we exported from Insights.
Then we generated a scatter plot showing the relationship between the client-facing response time and the response time reported by our own Ruby agent from within the Unicorn process.

Notice anything weird?
The client-facing (nginx) and upstream (Unicorn) response times should be tightly correlated. Most of the “work” that nginx does for any given request is waiting for Unicorn to return a response. This tight correlation holds for requests in the 0 to 5 seconds range, but the graph shows a distinct “knee” at around 4.67 seconds. This was the first clue that something was amiss with the response time data in nginx (and thus in the API Overload Protection tool).
When we examined the requests with client-facing response times of 4 to 5 seconds in the nginx access log, we found a clear pattern. Many of them looked like this:
05/Feb/2017:06:49:02 -0800||404|4.668|-|-|127.0.0.1:8100|287|0|-|GET|https|/v2/applications/33591900/metrics.json|-|api.newrelic.com|NewRelic Exporter
The third and fourth items in the spreadsheet row shown above are the client-facing response code and response time. The fifth and sixth items are the upstream response code and response time. There are several strange things about this:
- This request shouldn’t have generated a 404 response. The URL is correct and leads to a real application.
- The corresponding transaction event in Insights had a reported duration of almost 30 seconds, much greater than the 4.668 seconds reported as the client-facing response time by nginx.
- Nginx lists the upstream response code and upstream response time as “-”, suggesting that it hadn’t yet received a response from Unicorn at the time that it wrote out this log line.
Building a repro case
This is where the assembled clues should, in retrospect, have been enough to tell us what was happening, but we were still scratching our heads.
We spent several hours trying to put together a repro case and chasing down dead ends related to esoteric Linux kernel network settings. The most straightforward explanation would have been that nginx was giving up on waiting for Unicorn before Unicorn could write back a response over the local socket, but this wasn’t supported by the evidence. Nginx was configured to wait much longer than 5 seconds for Unicorn to generate a response, and empirical testing confirmed that New Relic APM API requests of greater than 5 seconds in general did not show this same symptom.
In desperation, we used Linux's tail and awk commands to watch the nginx access log for requests matching this pattern. We were hoping to catch a live one in the act, so that we could capture a packet trace of the loopback interface to better understand what was happening on the communication channel between nginx and Unicorn.
Luckily, this yielded an unexpected clue. The occurrence of this symptom was rare, but seemed to mostly affect requests where the user-agent was listed as some kind of mobile device.
What’s unique about mobile devices?
Mobile devices often have much spottier network connectivity than do desktops. This means that they’re more likely to hit network timeouts due to the link between the client and nginx being slow. Could that be related to our issue?
Looking back at the access log lines from the original incident, we saw that 100% of them listed a user-agent of “New Relic Exporter.” Searching for that string on GitHub, we found the source for a publicly available tool for exporting data from New Relic into another storage system. Examining the source, we saw that the outbound requests it was making to the New Relic API had a client-side timeout of 5 seconds set.
Bingo! That lined up nicely with the knee in the response time graph noted above.
What happens when the client sets its own timeout?
Armed with the theory that the issue might be caused by clients setting a request timeout, we were able to easily try a test by just curl-ing a long-running request endpoint and then Ctrl-C-ing curl before it returned, while watching the nginx access logs at the same time.
Here’s a diagram that shows the sequence of events in this scenario:
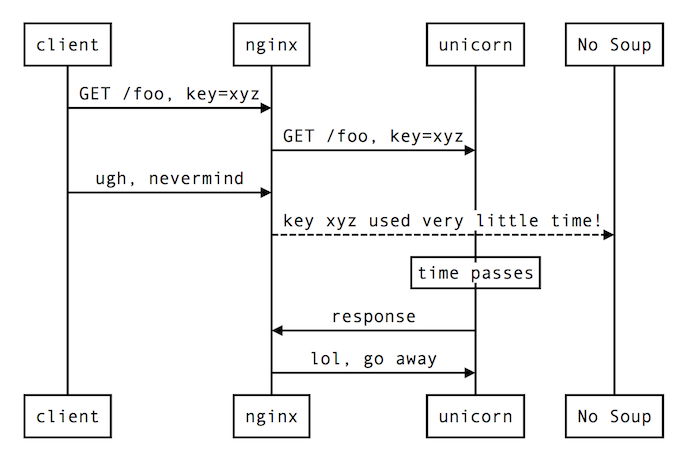
In short: nginx gives up when the client closes the connection, thereby triggering the Lua code that writes the response duration to the API Overload Protection tool early, while Unicorn is still busy processing the request. Because of another bug in the API Overload Protection tool’s Lua code, the response time that gets reported in this scenario is the default period rather than the amount of time that has elapsed so far for the request.
This problem disproportionately affects long-running requests, because those requests are more likely to hit a client-side timeout.
Wait … so why 404, exactly?
The 404 error code is somewhat of a strange choice of response code to be reported in this scenario. It turns out that nginx actually has its own special, non-standard response code for this scenario: 499 (client closed connection). So, why did we see 404s in the access log rather than 499s?
This looks to be a quirk of how nginx handles the post-action config file directive (which we use for running Lua code after the request completes) along with a client disconnect.
How can we fix it?
There are several possible solutions to this problem, but we chose to set the proxy_ignore_client_abort setting in the nginx config file used for APM’s API servers.
This setting instructs nginx to defer post-processing work associated with a request until the upstream server (Unicorn in our case) has actually sent a response, rather than performing it as soon as the client gives up and closes the connection.
This will ensure that the API Overload Protection tool gets a more accurate accounting of the amount of worker time consumed by each account, even when clients set an aggressive timeout value.
Hopefully, this discussion of New Relic’s approach to limiting API overloading can help you establish or update your own processes to deal with this issue. And even though this particular edge-case investigation may not be directly transferable to your own situation, we hope the processes we used to identify and correct the situation will help illuminate a path to resolving your own issues. If you want to learn more about accessing data directly or sending over data, learn how to send data with new Relic.
One thing is for sure: the rise of the API is going to continue, so finding ways to limit overloading is likely to become an even more important issue over time.
To learn about how we partner with customers to achieve success with Infrastructure monitoring, see our case with ZenHub
The views expressed on this blog are those of the author and do not necessarily reflect the views of New Relic. Any solutions offered by the author are environment-specific and not part of the commercial solutions or support offered by New Relic. Please join us exclusively at the Explorers Hub (support.newrelic.com) for questions and support related to this blog post. This blog may contain links to content on third-party sites. By providing such links, New Relic does not adopt, guarantee, approve or endorse the information, views or products available on such sites.


