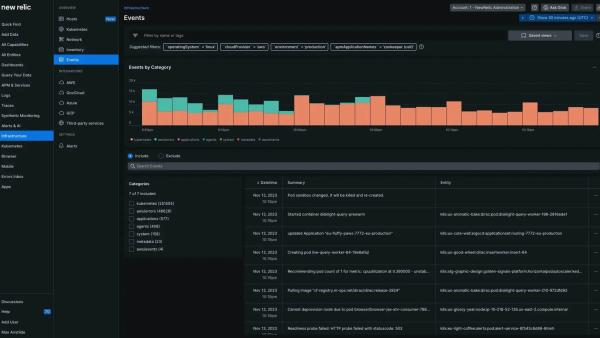
Amazon Simple Queue Service (SQS) is one of the known components for Event Driven Architecture, in the previous blog - Why observability matters for Event-Driven Architecture which dived into how SQS pre-built dashboards can bring in the right information with just Amazon CloudWatch Metrics Streaming integration as an out of the box solution.
In this blog, we will dive deep into SQS metrics beyond the health of the queue to explore monitoring with the New Relic’s powerful NRQL (New Relic Query Language) to build dashboards for message bottlenecks, and how tracking brings in comprehensive visibility.
Dive into NRQL for SQS metrics
New Relic Query Language (NRQL) allows you to query the Metric database from the CloudWatch Metrics integration. These queries can help with building insightful custom dashboards and intelligent alerts.
Eg. Let’s query all the metric attributes for one of the SQS queues.
SELECT * from Metric WHERE `aws.sqs.QueueName` = 'EDADemoQueueNodeJS'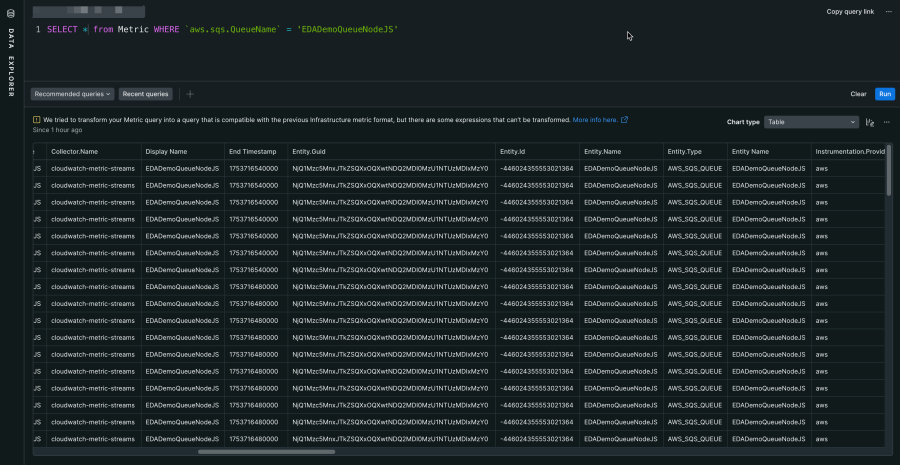
The key metrics we will look into in this blog are - ApproximateNumberOfMessagesVisible, NumberOfMessagesSent, NumberOfMessagesReceived and NumberOfMessagesDeleted.
ApproximateNumberOfMessagesVisible- The approximate number of messages that are available for retrieval from the queue.NumberOfMessagesSent- Number of messages sent to the queueNumberOfMessagesReceived- Number of messages returned by the ReceiveMessage API action or SQS triggers such as SNS topics, Lambda Functions.NumberOfMessagesDeleted- Number of messages deleted from the queue after they are received.
Learn about the other metrics from the documentation.
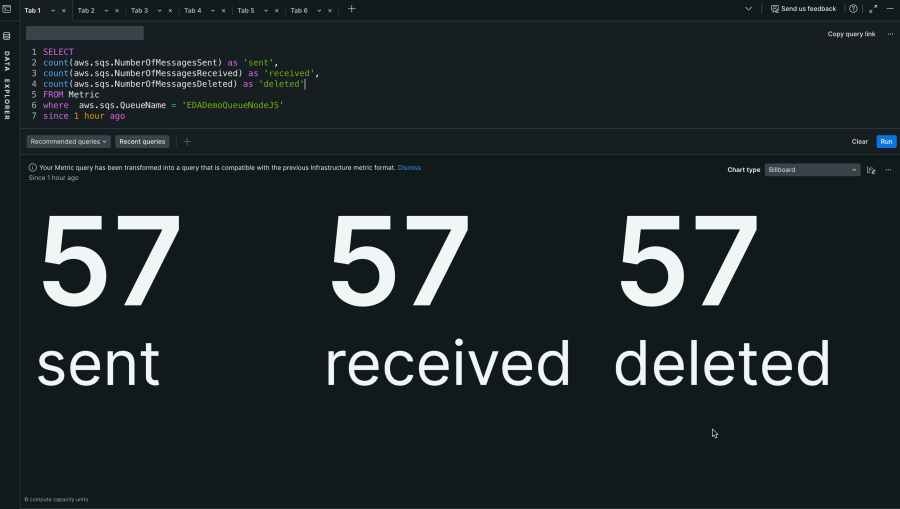
Query to check SQS messages metrics for a particular SQS Queue.
SELECT
count(aws.sqs.NumberOfMessagesSent) as 'sent',
count(aws.sqs.NumberOfMessagesReceived) as 'received',
count(aws.sqs.NumberOfMessagesDeleted) as 'deleted'
FROM Metric
where  aws.sqs.QueueName = 'EDADemoQueueNodeJS'
since 1 hour ago
A crucial aspect of monitoring SQS is ensuring that the number of messages sent to the queue matches the number of messages received and subsequently deleted. The query above provides a clear metric comparison across all three attributes to help you track this effectively.
Query to monitor SQS DLQ
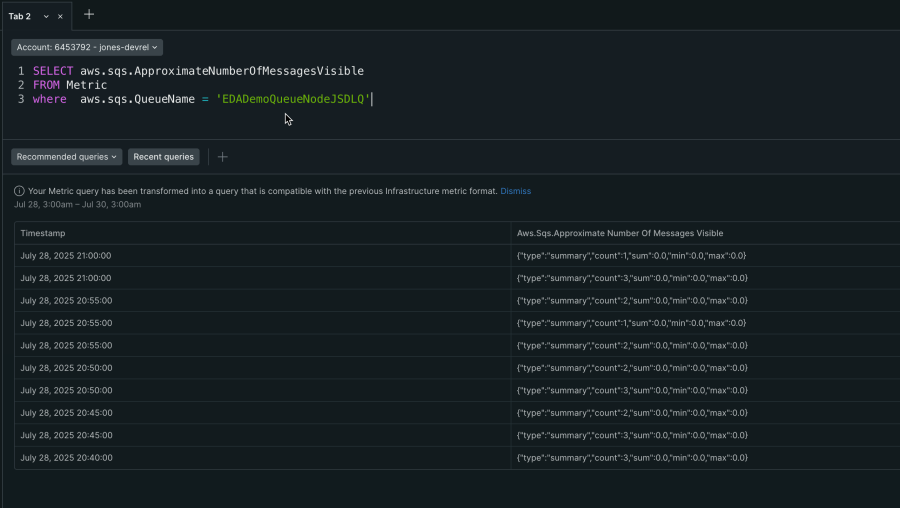
SQS Dead Letter Queues (DLQs) are specialized queues designed to store messages that could not be processed after the maximum number of delivery attempts. When monitoring the health of an application using the DLQ pattern, a healthy state is indicated by zero (0) visible messages in the DLQ. Any messages appearing in the DLQ should raise concern, as they signify unprocessed tasks that require attention.
SELECT aws.sqs.ApproximateNumberOfMessagesVisible
FROM Metric
where  aws.sqs.QueueName = 'EDADemoQueueNodeJSDLQ'
The above NRQL query helps with fetching the metrics from Amazon CloudWatch Metrics Stream integration with ApproximateNumberOfMessagesVisible.
Also, ApproximateNumberOfMessagesNotVisible metric would return the number of messages currently being processed where higher number of count of messages would mean that message is poisoned and causing other messages in the queue to be delayed.
SELECT aws.sqs.ApproximateNumberOfMessagesNotVisible
FROM Metric
where  aws.sqs.QueueName = 'EDADemoQueueNodeJSDLQ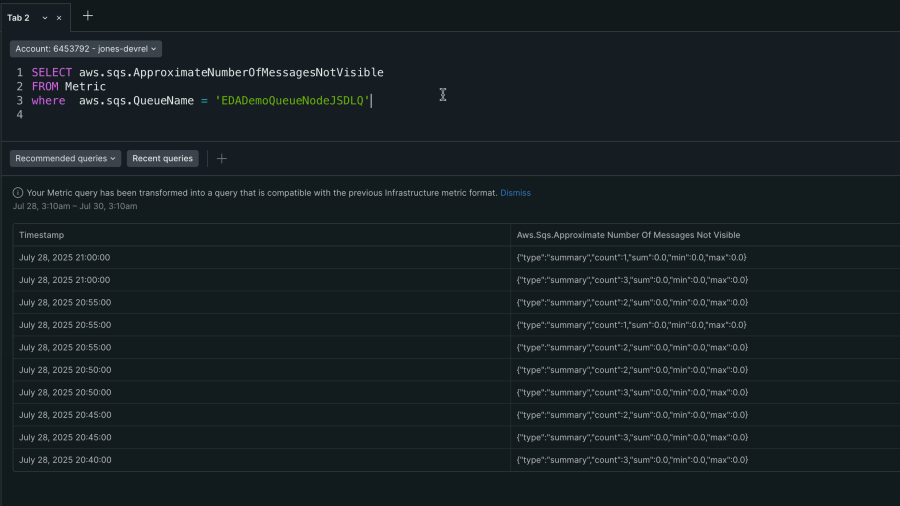
Query to monitor the performance and efficiency of SQS queues
In an Event-Driven Architecture (EDA) application, the performance and efficiency of SQS queues depend heavily on monitoring the size of the messages being transmitted. Larger payloads can lead to performance bottlenecks, system slowdowns, and increased costs due to higher data transfer requirements. By managing message sizes, you can ensure smoother data flow and maintain optimal performance.
SELECT max(aws.sqs.SentMessageSize)
FROM Metric
where  aws.sqs.QueueName = 'EDADemoQueueNodeJS'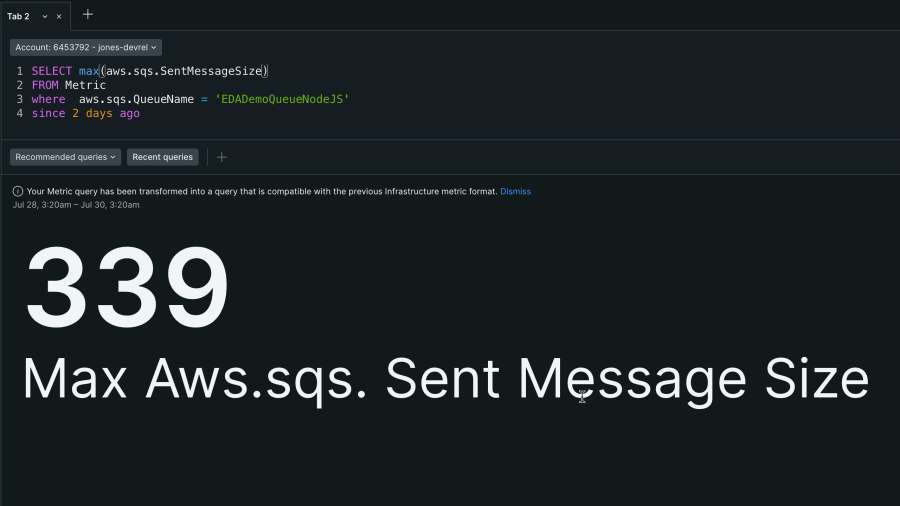
The max() function with NRQL would help you keep track of the maximum SQS message sent using the aws.sqs.SentMessageSize metric.
SELECT sum(aws.sqs.NumberOfEmptyReceives)
FROM Metric
where  aws.sqs.QueueName = 'EDADemoQueueNodeJS'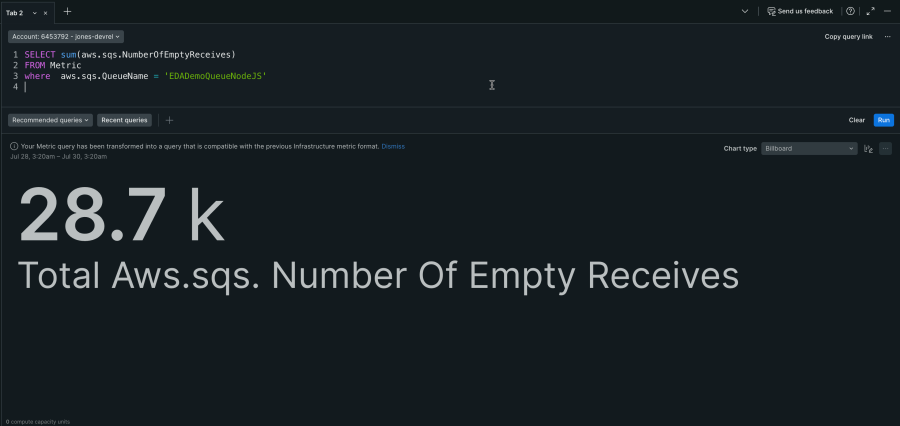
The sum() function in the NRQL query would perform summation on the NumberOfEmptyReceives metric of the SQS queue.
Bringing the value of traces for Lambda with SQS patterns
In the Lambda - SQS pattern, where messages are posted to the SQS queue from the Lambda function, the value of tracing plays a crucial role in ensuring the overall efficiency and reliability of the system. Tracing helps developers identify bottlenecks in the message flow, diagnose errors more effectively, and gain insights into the performance of both the Lambda function and the SQS queue. By leveraging tracing, teams can pinpoint areas where performance optimization is needed, such as high latency in message delivery or processing. This ensures a smoother operation of the system, improves debugging capabilities, and enhances the scalability of the architecture to handle larger workloads.
- Latency analysis: Identify the sources and points of delay when using any other HTTP request or AWS SDK invocations such as SendMessage SQS API. Additionally, check if the Lambda function is invoking any other synchronous APIs that might be contributing to the delay.
- Errors detection: Identification of Lambda errors and which AWS SDK API or HTTP endpoint failed when processing messages or posting messages to the SQS queue.
By enabling Distributed Tracing for Lambda functions, you can leverage custom instrumentation to gain deeper insights into traces, enriched with detailed segments and custom attributes.
return await newrelic.startSegment('SendMessageToSQS', false, async () => {
        try {
            const command = new SendMessageCommand({
                QueueUrl: SQS_QUEUE_URL,
                MessageBody: JSON.stringify(messageBody),
                MessageAttributes: messageAttributes
            });

            const response = await sqsClient.send(command);
            console.log("Message sent to SQS. MessageId:", response.MessageId);

            newrelic.addCustomAttribute('sqsMessageId', response.MessageId);

            return {
                statusCode: 200,
                body: JSON.stringify({
                    message: 'Message sent successfully to SQS',
                    messageId: response.MessageId,
                    traceId: traceId
                })
            };
        } catch (error) {
console.error("Error sending message to SQS:", error);
            newrelic.noticeError(error);
            return {
                statusCode: 500,
                body: JSON.stringify({ error: error.message })
            };
        }
    });
The custom instrumentation described above leverages distributed traces alongside segments to provide a detailed analysis of code latency. For instance, it measures the latency of API calls like SQS's SendMessage, which exhibits approximately 60ms of delay. In a production environment, combining multiple segments and spans offers a clearer, more comprehensive visual breakdown of Lambda's performance, particularly when integrating with various APIs and SDKs. Additionally, leveraging custom attributes like MessageId from an SQS message allows you to accurately identify which specific message from the SQS queue is linked to the trace.
Monitoring Lambda triggers from SQS queues
In a traditional event-driven architecture (EDA) application, Lambda functions play a dual role: they send messages to SQS queues and act as consumers retrieving messages from them. To gain deeper insights into the health of the EDA application—particularly the consumer Lambda function—it is essential to instrument the consumer function to send telemetry data to New Relic. This blog focuses on utilizing the New Relic Lambda Layer for efficient instrumentation and monitoring.
For Lambda Functions, you can monitor SQS queues as the event source for a specific function. For each invocation, gain detailed insights into the execution trace, including a breakdown of duration and key attributes of both the Lambda function and the SQS queue. These metrics capture critical data, such as execution time, error rates, and the number of event triggers, providing a comprehensive view of performance and efficiency.
let NRLayer = lambda.LayerVersion.fromLayerVersionArn(
        this,
        'NRLayer',
        nrLayerArn
      )

const sqsConsumerLambda = new lambda.Function(this, 'SqsConsumerLambda', {
      runtime: lambda.Runtime.NODEJS_22_X,
      handler: "newrelic-lambda-wrapper.handler",
      code: lambda.Code.fromAsset(path.join(__dirname, '../lambda-consumer')),
      memorySize: 256,
      timeout: cdk.Duration.seconds(30),
      architecture: lambda.Architecture.X86_64,
      environment: {
        ENVIRONMENT: environment,
        SERVICE_NAME: serviceName,
        NEW_RELIC_ACCOUNT_ID: nrAccountID,
        NEW_RELIC_LAMBDA_HANDLER: 'index.handler',
        NEW_RELIC_LICENSE_KEY: nrLicenseKey,
        NEW_RELIC_EXTENSION_LOG_LEVEL: "DEBUG",
        NEW_RELIC_EXTENSION_SEND_EXTENSION_LOGS: "true",
        NEW_RELIC_EXTENSION_SEND_FUNCTION_LOGS: "true",
        NEW_RELIC_EXTENSION_LOGS_ENABLED: "true",
        NEW_RELIC_COLLECT_TRACE_ID: "true",
        NEW_RELIC_DISTRIBUTED_TRACING_ENABLED: "true",
      },
      role: lambdaRole,
      tracing: lambda.Tracing.ACTIVE,
      layers: [NRLayer],
    });

   const eventSource = new lambda.EventSourceMapping(this, 'EDASqsQueueEventSource', {
      eventSourceArn: EDASqsQueue.queueArn,
      target: sqsConsumerLambda,
      batchSize: 1, // process one message at a time
      enabled: true,
    });
The provided CDK code snippet demonstrates that integrating a Lambda function with New Relic is straightforward and effective. Combined with CloudWatch Metrics, the New Relic platform provides comprehensive telemetry data, offering complete visibility into function invocations.
Next steps
With this setup, you can deploy the same Serverless Event-Driven Architecture (EDA) application to your AWS account and effortlessly integrate it with New Relic for enhanced observability. This integration is possible through the use of Lambda New Relic Layers and CloudWatch Metrics, which work together to provide seamless monitoring and logging capabilities. By leveraging the detailed telemetry data collected from these integrations, you gain deeper insights into your application's performance and behavior. Furthermore, you can use this data to create insightful, customized dashboards using the NRQL (New Relic Query Language) queries mentioned above, enabling you to monitor key metrics, identify potential issues, and optimize your system for better efficiency and reliability. This comprehensive approach ensures full visibility into your serverless application's operations.
The views expressed on this blog are those of the author and do not necessarily reflect the views of New Relic. Any solutions offered by the author are environment-specific and not part of the commercial solutions or support offered by New Relic. Please join us exclusively at the Explorers Hub (discuss.newrelic.com) for questions and support related to this blog post. This blog may contain links to content on third-party sites. By providing such links, New Relic does not adopt, guarantee, approve or endorse the information, views or products available on such sites.


