eBook

Best Practices for Monitoring Cloud-Based Applications and Infrastructure

Modernize your applications and infrastructure by monitoring every step of your cloud journey

puffy cloud that appears to be made out of cotton hanging over light blue background

Overview

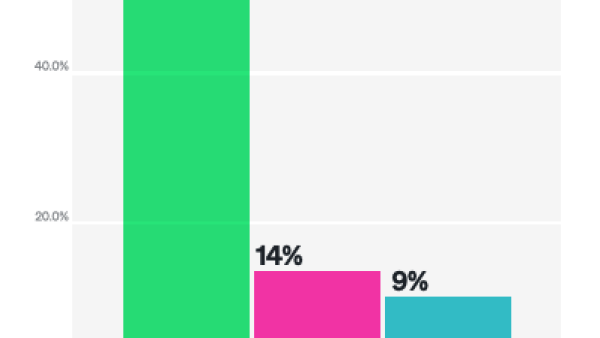
Despite its overwhelmingly positive impact, the rise of cloud computing has undoubtedly created many new challenges for the development and operations of applications. But those very challenges also represent an unprecedented opportunity for enterprises to fundamentally rethink the way they develop, monitor, and maintain their IT environments. Perhaps most notable is the chance to finally address the archaic (or non-existent) way in which monitoring has traditionally been approached in on-premise environments. According to a recent Gartner survey, a staggering 80% of enterprises still feel they are either completely blind or have significant gaps when it comes to monitoring their new cloud solutions. 

Legacy applications were developed when monitoring tools were often seen as cumbersome and expensive, so many companies consciously chose not to address the issue. But this decision often carried a hefty price tag in the form of longer, more frequent outages; unfocused refactorings leading to missed regressions; and, in many cases, a “don’t touch anything” mindset that stifled innovation and stalled business goals. With the availability of New Relic’s platform, this tradeoff is simply no longer necessary or acceptable. It’s time to embrace the fresh start and new challenges promised in the cloud. 

What is your ability to monitor your cloud environment chart

No matter where you are in your cloud journey, this guide is intended to provide best practices to help you avoid this common pitfall. By emphasizing pragmatic monitoring before, during, and after moving to the cloud, you stand a better chance of enjoying the cloud’s full benefits—and efficiently delivering a reliably delightful digital customer experience. 

Specifically, we will focus on three key questions: 

  1. How do you successfully migrate existing applications?
  2. How do you troubleshoot applications and infrastructure in the cloud?
  3. How do you continue to modernize your business without regressing?
     

Question 1: How do you successfully migrate existing applications? 

For most enterprises, the luxury of starting from scratch in the cloud is simply not an option. Typically, years of effort have been poured into existing on-premise applications, so the initial goal is usually to port those existing applications to the cloud. Traditionally, this takes the form of a direct deployment of the existing on-premise codebase to cloud VMs (i.e., a “lift and shift” migration) or a straightforward refactoring of the code while maintaining the existing interfaces (i.e., “a re-architecture”). Either way, the following best practices can help ensure a successful move to the cloud:


Start your baseline from your end-user’s perspective

To understand whether your applications’ performance has gotten better or worse in the cloud, you need to know how those apps performed before you moved them there. Thus, the first step of your cloud migration process should be to establish the baseline performance of your on-premise solutions. 

Many enterprises approach this by focusing on individual services or the supporting infrastructure, but what matters most is how your end users experience the application. Monitoring only individual components can create blind spots around such issues as network latency or failing load balancers. Measuring your initial baselines with a tool like New Relic Synthetics (which programmatically simulates real user requests) or New Relic Browser (which offers real-user monitoring of the entire life cycle of a page or view) gives you a measuring stick for the success or failure of your cloud migration.

Specific metrics to focus on here include: 

  1. Response time: How long does it take my page to load from the backend server? 
  2. Error rate: How often do requests for my application result in failures? 
  3. External services: How long does it take my application to communicate with other services (internal and external)? 

Benchmark cloud migration metrics only if they make sense 


If you’re performing a lift-and-shift migration, your application should be more or less identical to its on-premise equivalent. That makes it relatively straightforward to repeat the instrumentation process from your baselines on your cloud application—and be able to compare the exact same metrics. If, however, you’re re-architecting your application for the cloud, don’t worry about duplicating the baselines of the individual microservices when the architectures no longer align. Remember, tracking the end-to-end experience is your primary concern; be practical about the value you’ll get from specific elements of your monitoring. 


Be ready for everything to break—because something probably will 

Even though monitoring your end-user experience is a top priority, it’s only the beginning. When you’re moving parts of your apps into and around in the cloud, things will inevitably break and you’ll want the ability to see everything you need to fix those problems quickly. That means you’ll need full coverage of your entire stack. 

New Relic Insights - dashboard 2017

The closer your monitoring comes to your end-user experience, the easier it will be to quickly identify regressions in the overall experience you deliver. But the closer your monitoring is to the underlying code and infrastructure, the faster you’ll be able to pinpoint exactly why those regressions occurred. The solution is to instrument every tier in your stack (frontend, backend, infrastructure) and familiarize yourself with normal behaviors. That way you’ll be ready when anomalies occur. This is where the entire New Relic platform—from New Relic APM to  New Relic Infrastructure—can be so valuable. 

Don’t bother baselining on-premise infrastructure

Many enterprises feel it necessary to baseline their on-premise infrastructure prior to moving to the cloud, but this often yields little value. Who cares if your hosts have different CPU or memory utilization in the cloud than they did in your data center? This, of course, doesn’t mean you should never instrument your on-premise infrastructure, but if your applications’ end-user experience baselines are consistent or improved, changes in the underlying infrastructure don’t really matter. In many cases, you’ll even be seeking distinctly different performance characteristics in the cloud than you did on-premise. 


Treat cost as a metric

In the on-premise world, you generally don’t consider cost when delivering your application. Most on-premise costs are found in the resources already requisitioned by your company (if cost is a problem, you’ll either be blocked or get notified by someone who is monitoring capacity). In the cloud, however, you have access to ostensibly infinite resources, but using them haphazardly can result in unnecessarily large bills. Cost should—and can—be monitored just like any other metric. Using New Relic Infrastructure’s native AWS integrations, you can easily keep track of your cloud costs and budgets in New Relic Insights

Don’t throw away your hard work

Once you establish solid baselines, track core metrics like response time and error rate, and have the ability to delve into detailed debugging sessions on the fly, don’t throw it all away just because you’ve completed your cloud migration. Regressions in these services are inevitable over time, and retaining these baselines can help you detect any issues that crop up. So instead of deleting them when you complete your move to the cloud, leverage them by creating New Relic Alerts and New Relic Insights dashboards. These free features can help you operationalize the baselines you created to deliver consistently great experiences for your end users. Interested in other great tips on how to ensure a seamless migration to the cloud? Be sure to check out Lee Atchison’s “Measurement at the Moment of Truth” Amazon blog post. 

Question 2: How do you troubleshoot applications and infrastructure in the cloud? 

Think for a moment about this question. For most enterprises, the answer is something like, “After receiving a ticket from a frustrated customer, I ssh/rdp into my machines, sift through log files, and ultimately guess at the issue.” Now, imagine you don’t have access to the underlying machines (as you often don’t in the cloud). Or imagine that your application is dynamically scaled and log files are ephemeral. Or that your application is composed of numerous microservices distributed across a pool of hosts. All the time you spend addressing those concerns is not helping your customers use your applications better or your business make money. Efficiently finding and addressing issues is critical to success for modern digital businesses, and the best practices listed here can help you stay ready for anything that can go wrong: 


Monitoring is not your business, so don’t treat it like it is


Remember, your business gets no added value for solving the monitoring problem yourself. Investing heavily in home-brewed solutions—especially for commoditized cloud platforms—means throwing a lot of money at a solution that will inevitably be less robust than one provided by a top vendor that focuses on this problem full-time. Building a monitoring solution like the New Relic Digital Intelligence Platform requires multiple data types and storage systems, massive scaling concerns, enterprise-grade security, and deep technical knowledge across a broad swath of technologies. 


Be ready for deep dives and horizontal debugging

In the cloud, especially in cloud-first architectures, applications often shift from vertically scaled monoliths to highly distributed microservices stitched together with platform components across multiple hosts and even multiple cloud providers. To deal with these complex systems, make sure your monitoring system enables visibility across tiers. Many systems focus exclusively on targeted deep-dives, but in the cloud you need to know where to start looking first. Tools such as New Relic service maps and health map are designed to help you find that proverbial needle in the haystack by starting with a bird’s-eye view and then letting you zoom in on any components that may be acting strangely. 

Don’t wait until you have an issue

Many enterprises hesitate to add monitoring until they’ve already experienced a critical outage. Don’t be that company. Instead, work to gain visibility everywhere you can. The cost of the tools will often be made up by more quickly resolving issues that do arise and by the easy identification and awareness of bottlenecks that might otherwise have gone unnoticed. The only things you should decide not to monitor are the ones you truly don’t care about. 

Monitor the infrastructure that supports your applications

Why do you monitor a server? Is it because you just care about the well-being of your VMs? Probably not. The reason servers matter is because they support your applications. Don’t go crazy over-instrumenting your infrastructure tier without choosing tools that tie that information back to what gives them value: the applications. Average CPU usage across all of your machines is a factoid; average CPU usage for machines hosting a specific application in a specific region is potentially critical debugging feedback. 


Collect meaningful data 

Some traditional monitoring solutions take shortcuts when it comes to working at true scale. They require you to tell them what types of data to collect and rigidly store only those fragmented pieces of the overall story. So you have to know in advance what data is going to be most useful for answering questions you don’t even know to ask yet. In the cloud you want to collect every bit of relevant information you can. Thankfully, New Relic Insights lets you quickly inspect the wide variety of unaggregated and multidimensional data that New Relic collects for you. This enables you to formulate the questions that you care about on the fly. You can even save your query and put it up on a dashboard so you never have to ask it again!


Ensure cross-cloud and on-premise debugging for hybrid cloud solutions

Despite the cloud’s incredible growth, no one cloud vendor is perfect for all occasions, and it’s unlikely that you’ll be able to fully deprecate on-premise applications and infrastructure any time soon. For best results, embrace this diversity and choose a monitoring solution agnostic to where your code is hosted. On-premise, in the cloud, on your laptop, even on a Raspberry Pi, New Relic has you covered.  


Question 3: How do you continue to modernize your business without regressing? 

The cloud has opened many doors, but like any great innovation, its full potential will take some time to be recognized. When choosing a monitoring solution, you should aim to future-proof yourself so you don’t have to revisit this process again in a few years. The best practices below are intended to help you stay current with today’s latest developments and keep you from painting yourself into a corner when it comes to tomorrow’s trends: 


Be prepared for both pets and cattle


On-premise is the world of puppies—special servers with special names that deserve special little rows in your monitoring solution. In the cloud, however, you’re more likely to encounter cattle—interchangeable, nameless, and ephemeral servers that require focus on the individual only in how it relates to the cluster. You’re likely to be dealing with both for a while, however, so you need a monitoring solution that handles them equally elegantly. New Relic Infrastructure easily enables visibility into all tiers of compute with dynamic filtering and grouping via labels. From traditional on-premises hosts, to IaaS VMs, Docker containers, and even serverless AWS Lambda functions, New Relic Infrastructure has you covered. 


Don’t ignore platform components

In the cloud, you have to acknowledge that your application is no longer just a process running on a host. Cloud platform components matter—they can be as integral to your application’s performance and success as the VM it’s deployed to. If you are using a load-balancer, cache, NoSQL datastore, queue, or any other platform component, treat it like any internal service you developed yourself. Just remember to tie them back to the applications they support in order to derive their true value. New Relic Infrastructure integrations let you not only see the components that matter, but also the context in which they matter. And you can fill any custom gaps you may have to maintain with the New Relic Infrastructure integrations SDK

Don’t lock your monitoring into a single cloud infrastructure vendor

No one wants to lock themselves into a single cloud infrastructure vendor. Even if you’re happy with one vendor now, at some point you may want to take advantage of the innovations of another vendor, whether or not you keep using your original one. The question is, once you’re ready to branch out, will your monitoring solution be ready to go with you? Many cloud vendors offer their own lightweight free-tier monitoring, but what if you want to go multi-cloud or you need to attach to another team’s on-premise service? It’s safer to choose a vendor-agnostic platform like New Relic from the very beginning. 


Monitor your business

Monitoring is sometimes considered an exclusively technical requirement, but that’s a shortsighted view. As the cloud frees your team from the need to monitor backend infrastructure components, you can begin to focus on the metrics that are important to your business. When choosing a monitoring solution for the cloud, look for extensibility to track what’s really important to you and your business. New Relic’s agents have powerful APIs to let you report custom metrics, attributes, and events about your system and end-user experience. You can extend the information you’re operationalizing around via alerts, dashboards, and NRQL queries to include signals specific to your business—and even begin to correlate performance to key business outcomes.


Next steps

No matter what your goals are in the cloud, following this collection of best practices for monitoring cloud-based applications and infrastructure can help you shed your bad monitoring habits and get there faster, with more visibility on how well everything is working. With a modern monitoring solution, you’ll always have access to the information you need to successfully migrate your existing applications, troubleshoot your applications and infrastructure in the cloud, and continue to modernize your business.