Quickstart
Monitoring WebSphere Liberty Profile
Liberty Profile is a flexible server profile of IBM’s WebSphere Application Server (WAS) which enables the server to deploy only required custom features rather than deploying all available components.
Leverage our New Relic WebSphere Liberty Profile quickstart to proactively monitor your Liberty Profile with the New Relic Java agent.
New Relic WebSphere Liberty Profile highlights
New Relic’s WebSphere Liberty Profile monitoring instruments WebSphere with the New Relic Java agent and allows you to instantly monitor your Java application.
With New Relic's Java agent, you can track everything from active connections to tiny errors within your code. Every minute, the agent posts metric timeslice and event data to the New Relic user interface, where you can monitor your website’s performance.
New Relic + WebSphere Liberty Profile = Optimum performance monitoring
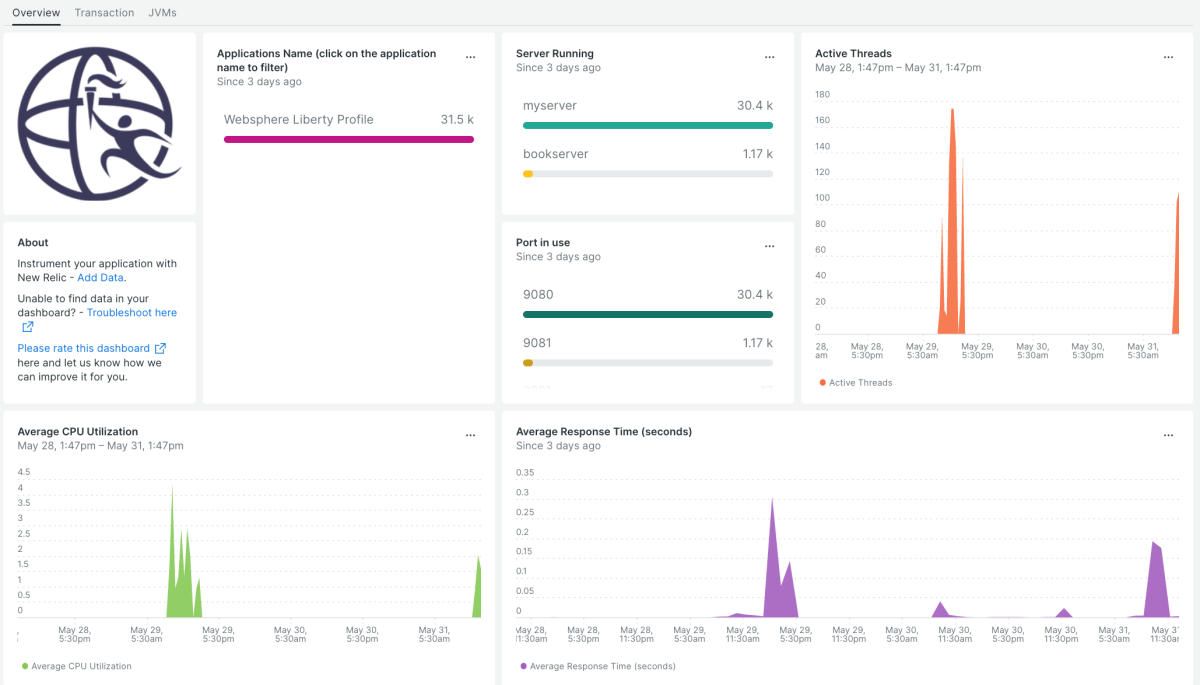
Our WebSphere Liberty Profile quickstart empowers you to configure New Relic’s Java agent for your WebSphere Liberty Profile. With a configuration customized for your application, you can monitor browser performance and WebSphere PMI metrics like memory, threads, and HTTP sessions.
New Relic supports all versions of WebSphere and IBM Java Virtual Machine that are compatible with the Java agent. (If you’re using Java 2 Security with WebSphere, you need to grant the Java agent additional permissions for proper execution).
You can also configure the Java agent to capture any WebSphere PMI metrics you want. Such metrics will be displayed on the New Relic JVM metrics page. These metrics will be listed under different tabs like memory, thread, HTTP sessions, and data sources.
The memory tab has heap memory usage, garbage collection and class count. The thread tab has thread count and thread pool. The HTTP sessions tab shows the active, invalidated by timeout, and invalidated HTTP session counts of your application. The data sources tab will show you metrics like wait time, max connections, active connections, and idle connections.
Install the New Relic WebSphere Liberty Profile quickstart to effectively monitor Liberty Profile key performance indicators with our Java agent. This quickstart is the key to making sure that you detect and respond to any incident quickly and efficiently.
Need help? Visit our Support Center or check out our community forum, the Explorers Hub.


