/ 
Docker (OpenTelemetry)

Docker (OpenTelemetry)

Monitoring docker is essential to enable your team deliver high-quality software that yields a positive customer experience. Install New Relic Docker for Open Telemetry quickstart to proactively instrument Docker with the Dockerstats receiver.

What's included?

dashboards
1
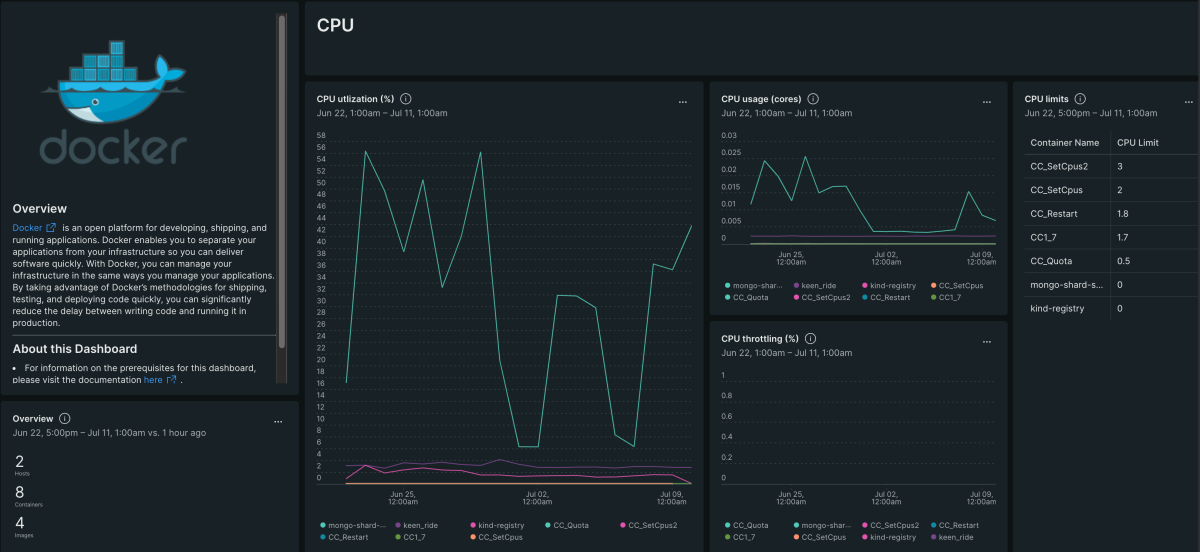
Docker (OpenTelemetry) quickstart contains 1 dashboard. These interactive visualizations let you easily explore your data, understand context, and resolve problems faster.
alerts
2
Docker (OpenTelemetry) observability quickstart contains 2 alerts. These alerts detect changes in key performance metrics. Integrate these alerts with your favorite tools (like Slack, PagerDuty, etc.) and New Relic will let you know when something needs your attention.
CPU Utilization is too high
This alert is triggered when the CPU Utilization is above 90%.
Memory Utilization is too high
This alert is triggered when the Memory Utilization is above 90%.
documentation
1
Docker (OpenTelemetry) observability quickstart contains 1 documentation reference. This is how you'll get your data into New Relic.

How to monitor Docker with New Relic?

Dockerstats OpenTelemetry receiver collects metrics from your running Docker containers on the host where OpenTelemetry Collector is installed. The collected metrics allow you to observe the usage of CPU, memory, network, and more.

A New Relic container entity will be created for each container, making it easy to explore, configure alerts and compare metrics for all of your containers in one place.

Our monitoring quickstart includes a pre-built dashboard that displays aggregated metrics from all of your containers, with the ability to filter the data to focus on specific workloads.

Why monitor Docker with New Relic?

New Relic's Docker for Open Telemetry quickstart empowers you to get 360° visibility for your apps, server infrastructure, and Dockerized containers all in one place. Monitoring Docker is critical to get instant performance metrics for containerized applications across your entire environment. It enables you to provide a consistent customer experience, regardless of changes to the underlying platforms, tools, languages, or frameworks.

How to use this quickstart

  • Sign Up for a free New Relic account or Log In to your existing account.
  • Click the install button.
  • Install the quickstart to get started or improve how you monitor your environment. They're filled with pre-built resources like dashboards, instrumentation, and alerts.
Authors
New Relic
Support
BUILT BY NEW RELIC
Need help? Visit our Support Center or check out our community forum, the Explorers Hub.