Quickstart
Comprehensive monitoring for Blazor Server
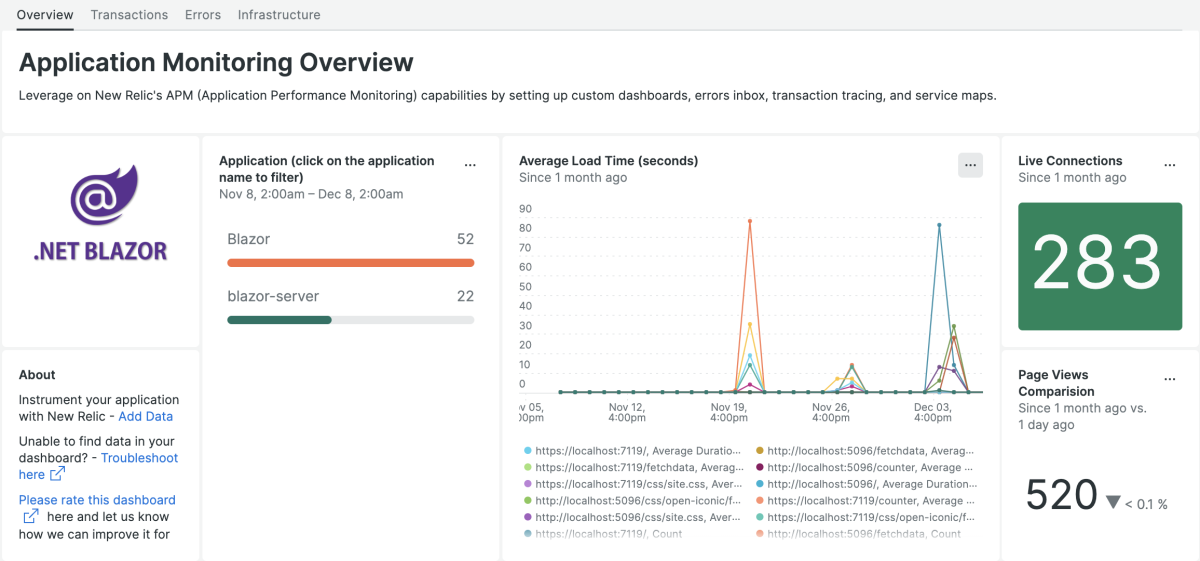
Microsoft developed Blazor Server to build web UIs with C#, HTML, and CSS. As a feature of ASP.NET, our Blazor Server integration with the .NET agent lets you monitor your apps with our quickstart dashboards right out of the box.
Despite being an extremely innovative and exciting new technology, Blazor Server is a relatively new technology. That means there may be some issues that arise during development and deployment as with any new technology.
Why monitor your Blazor Server?
Optimize Performance:
Blazor Server apps rely on SignalR for real-time communication between the client and the server, which can result in slower performance compared to traditional client-side Blazor apps.
Improve Scalability:
Blazor Server apps may struggle with high levels of traffic, as each client connection requires a separate server-side connection.
Debug Quickly:
Debugging Blazor Server apps can be challenging, as the source of errors may be difficult to determine.
Optimize State Management:
Managing state in Blazor Server apps can be more complex than in traditional client-side Blazor apps, as state must be shared between the client and the server.
Lower Bandwidth Consumption:
Blazor Server apps may consume more bandwidth compared to traditional client-side Blazor apps, as data is constantly being sent back and forth between the client and the server.
Unleash the power of C# for web development with Blazor Server. This innovative technology not only lets you use your preferred language, but also provides a plethora of useful features. Experience the freedom to run your code on either the server or the client with Blazor Server and tailor the user experience for each device. Embrace a new era of web development with Blazor Server.
Need help? Visit our Support Center or check out our community forum, the Explorers Hub.


