Through all the recent announcements at New Relic, we’ve been working double time to ensure you have the best tool available for performance visibility into your web applications and frontend.
While it has a new home within our Full-Stack Observability product, we’ve made improvements to our Browser agent and Real User Monitoring (RUM) capabilities, including:
- W3C Trace Context standardization
- Cumulative Layout Shift to measure a page’s visual stability
These new improvements help both frontend and web developers—who are increasingly spending time in incident resolution—focus on their main role of solving problems with software. We’ll walk through what each of these new additions mean for you below. If you prefer hands-on activities, check out how to use core web vitals in our Improve website’s performance tutorial.
Expanding W3C Trace Context standardization
In our continued standardization of W3C Trace Context, the New Relic Browser agent now offers the standard trace context. W3C Trace Context enables cross-vendor interoperation of traces and helps ensure that, when using distributed tracing, you can troubleshoot services instrumented with agents from other vendors without risking broken or incomplete traces. Additionally, this also ensures that you’ll be able to reliably traverse third-party components, including proxies and API gateways.
Additionally, the W3C Trace Context offers the same advantages upon open source tracers, enabling you to incorporate tracing telemetry data from any source, at any time, and to implement traces across highly-distributed application environments.
Faster troubleshooting
Now, if your team is using New Relic’s distributed tracing, you will be able to troubleshoot faster by completely connecting latency, errors, and anomalies to their origins. So if you build and ship code, and also carry a pager, you’ll benefit from complete visibility into traces propagated through your end-user data, helping you find answers in every trace faster than ever.
For background, W3C Trace Context provides a common context propagation format that allows spans to pass data through their trace paths. New Relic agents have maintained backward compatibility—accepting and emitting both the W3C format as well as the New Relic proprietary format—which makes it possible for customers to upgrade agents without special consideration for what format is being used.
Until recently, each distributed tracing tool employed custom headers and context formats—for example, Zipkin’s B3 format and New Relic’s own proprietary format. Having mutually-incompatible header formats is problematic as services have become more distributed: across teams, organizations, and when traversing boundaries including proxies, service meshes, and messaging systems. Some of these systems and devices passed along proprietary headers intact, but many others dropped them entirely, which resulted in fragmented traces.
Functionally, W3C Trace Context defines a pair of standardized context HTTP headers that serve to propagate context correlation information between services:
- A
traceparentheader contains the data elements that every distributed tracing model requires to define and propagate context: a trace ID, a parent ID, and a sample flag. - A
tracestateheader holds vendor-specific, contextual data, typically to support additional functionality or optimizations associated with a particular tracing tool.
In short, regardless of where data is from, including third-party vendors, it will have the standard W3C Trace Context, helping propagate data for engineers looking to troubleshoot problems.
How to Enable W3C context trace in Browser agent:
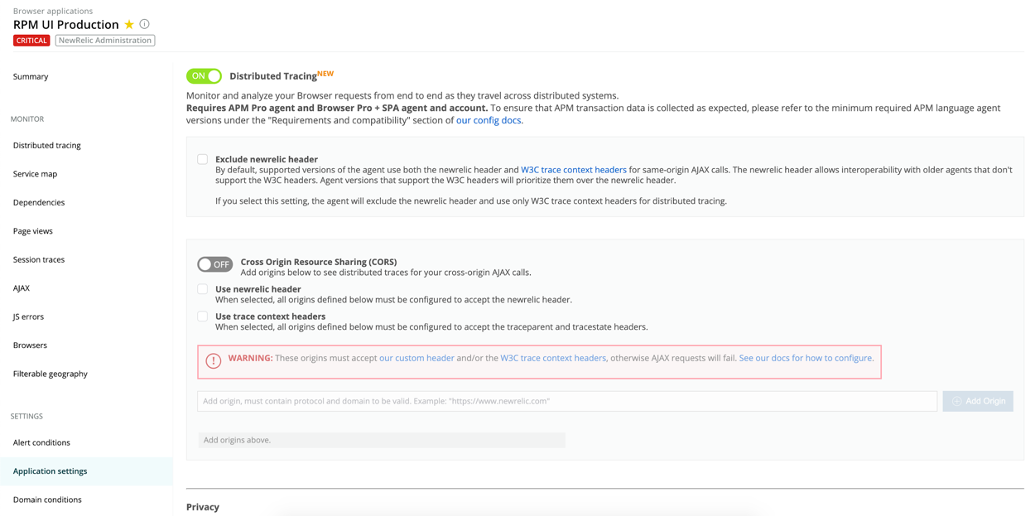
- Turn on distributed tracing in your Browser application settings page
- If your system is fully configured to send W3C Trace Context throughout all services, you can choose to disable the New Relic header from the Application setting tab.
- For cross origin AJAX requests already configured to accept the New Relic header, you can now select the option to send the W3C Trace Context headers
- When selected, all origins defined must be configured to accept the traceparent and tracestate headers
- For information on configuring CORS headers, please see our docs page for an example
See our release notes for more information about standard trace context.
New Metric: Cumulative Layout Shift
We’ve added Cumulative Layout Shift (CLS) to measure and improve webpage stability. CLS measures how often the end user experiences unexpected layout shifts, which are usually caused by resources, such as images, videos, and fonts being loaded asynchronously. Another common cause is DOM elements being dynamically added to the page above existing content, that later resizes.
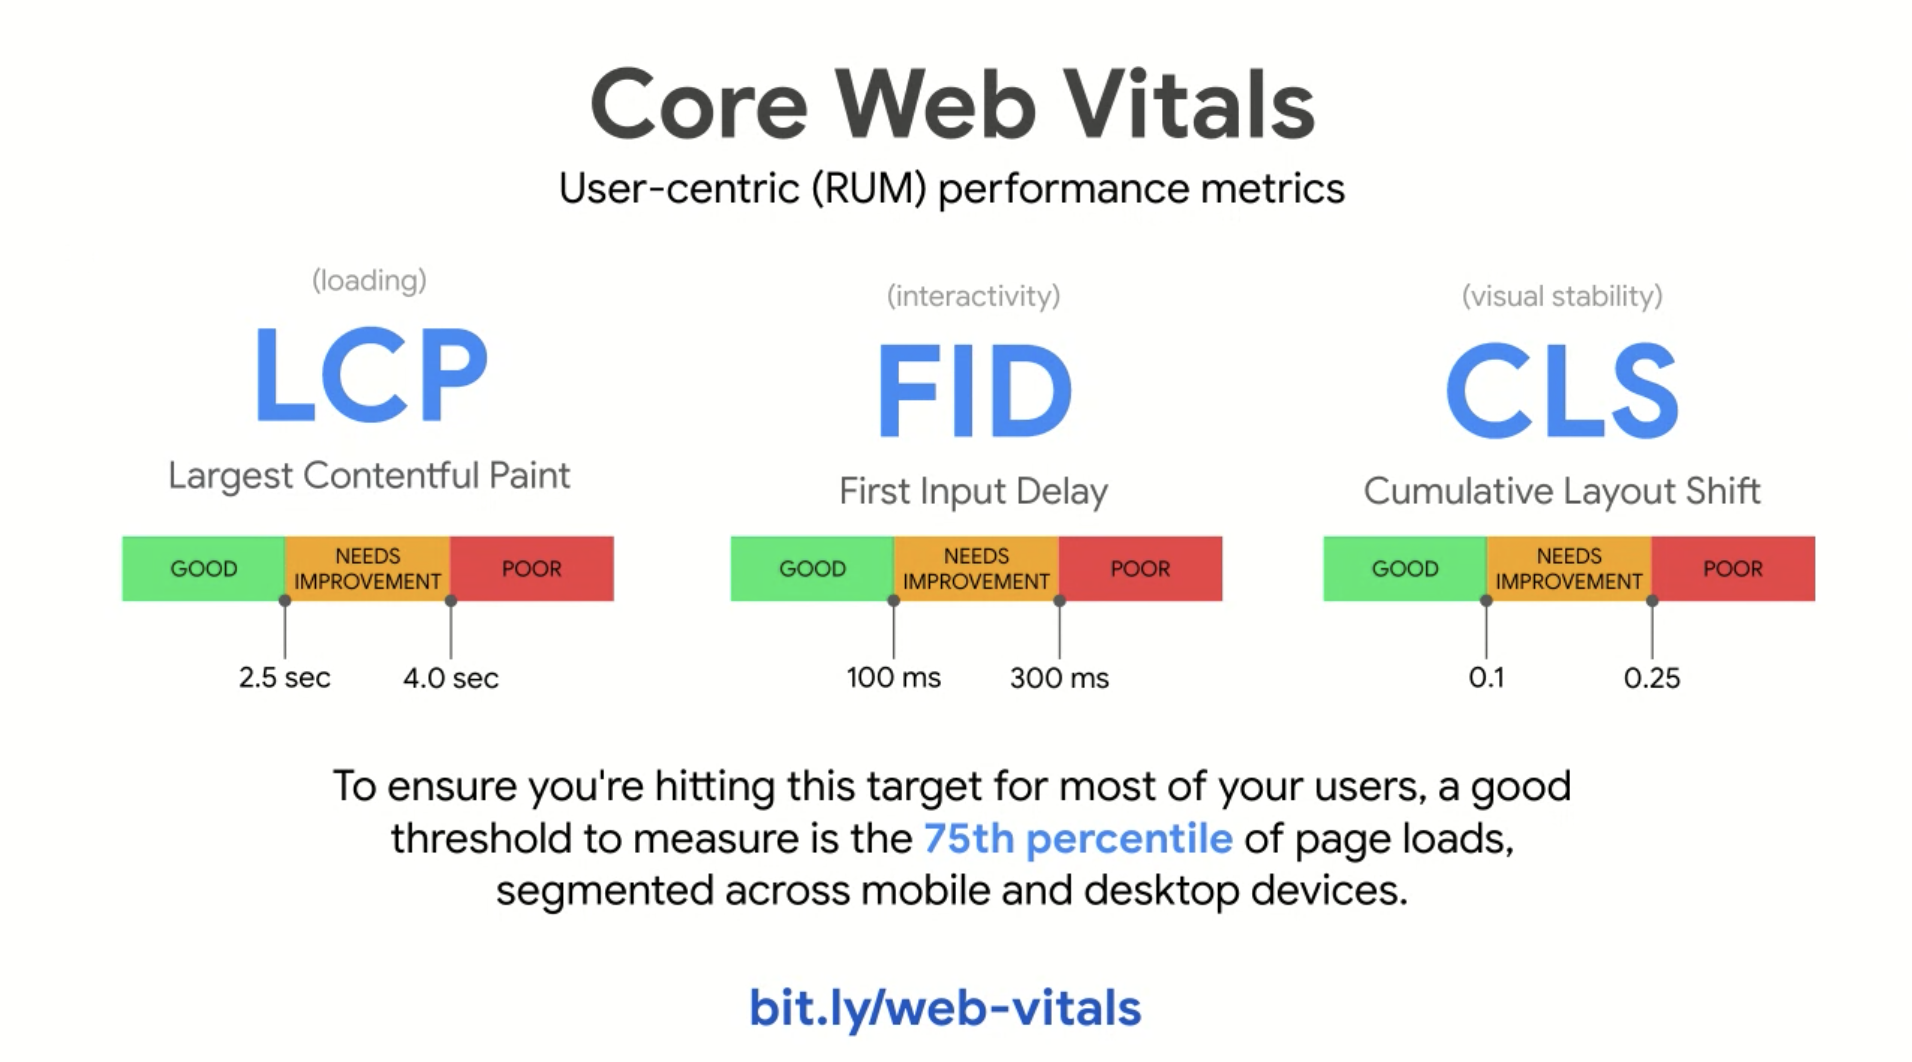
In addition to adding CLS, we’ve also implemented First Input Delay (FID), along with other interactivity metrics, and Largest Contentful Paint (LCP), which means our users now have all three metrics that represent Google’s Core Web Vitals.
CLS is calculated by comparing two frames of the browser’s viewport—what the end user sees on their screen—and multiplies the percentage of space taken up by an element changing locations in the viewport (impact fraction), by the distance an element has moved (impact distance). For example, a block of text that is 50% of an iPhone screen’s size suddenly shifts down by 25% of the page (impact fraction = 75% of the screen), times the greatest distance the unstable element has moved (impact distance = 25% of the page). The result is a layout shift score, which in this case measures .75 x .25 = .1875.
Teams looking to standardize on web performance metrics can now use CLS as a user-centric metric for visual stability of their pages. Along with page load metrics like LCP or First Contentful Paint, and interactivity metrics like FID, teams can now use New Relic to get a more rounded view of end-user performance. Google recommends that page owners segment the 75th percentile of page loads for desktop and mobile traffic in calculating performance thresholds.
For apps with large content that frequently resizes, or any mobile web experience where elements take up sizable portions of the customer’s viewport, teams can now better benchmark and improve several key aspects of their end-user experience. New Relic Browser takes this a step further and reports the CLS value in relation to other metrics in the page loading journey such as windowLoad, firstInteraction, pageHide, and windowUnload. By having this attribute associated with these other values, you can more easily identify the moment in the page loading journey that most impacts your CLS score.
For more on how to get started measuring Cumulative Layout Shift, view our release notes.
The views expressed on this blog are those of the author and do not necessarily reflect the views of New Relic. Any solutions offered by the author are environment-specific and not part of the commercial solutions or support offered by New Relic. Please join us exclusively at the Explorers Hub (discuss.newrelic.com) for questions and support related to this blog post. This blog may contain links to content on third-party sites. By providing such links, New Relic does not adopt, guarantee, approve or endorse the information, views or products available on such sites.


