We’re excited to announce the general availability of New Relic Infrastructure’s Redis integration. Customers with a subscription to New Relic Infrastructure Pro can now pull data from their Redis servers directly into New Relic without installing any third-party software. This on-host integration allows you to track key metrics and gain critical insights into how your Redis database is performing, giving you improved visibility into the parts of your infrastructure served by Redis.
Redis is an open source, in-memory key-value data structure store. Businesses in the gaming, IoT, and mobile industries—among others—rely on its fast performance and simple onboarding. Redis is gaining momentum in such industries for several reasons:
- Fast handling of in-memory, schema-less database transactions
- Ability to ingest and analyze very large datasets
- Data caching for high-performance applications
The performance of your application is directly affected by the performance of your database, so you need a holistic view of the entire stack to ensure you’re delivering continuous value to your users. New Relic Infrastructure gathers crucial performance and health metrics about Redis so you can easily troubleshoot common issues and improve overall database performance. Want to maintain the health and performance of your applications and integrations? Check out how we helped ZenHub.
Eliminate needless Redis troubleshooting
Redis is successful as a distributed caching layer because it provides fast, key-based access to in-memory storage. For instance, many modern web applications use “sticky sessions” in which a user’s session is cached in a database, like Redis, so they can be served by different application servers during the session. For web applications that offer services such as gaming and online shopping, it’s critical that user sessions persist.

Let’s say you host such an application using Redis as its default session handler. What happens if users suddenly get logged off in the middle of sales or other transactions? For one thing, you’re pretty likely to soon hear your pager going off.
To address the situation, you need to know whether these performance errors are caused by keys expiring too fast, or are your users are being logged off because the database is out of memory? Perhaps there’s an availability issue with a Redis instance, and you want to check your keyspace hits versus misses, or see which clients aren’t connected? Maybe the system just doesn’t have any CPU resources left?
Troubleshooting such issues, including guessing at the root cause, can often take a long time and consume valuable resources. With the New Relic Redis integration you can quickly find out why users are being logged off.
Critical performance and health metrics for monitoring Redis
Our new Redis integration includes a number of key performance and health metrics pulled from the Redis INFO command to help you troubleshoot common issues and improve overall Redis performance:
- Commands processed in seconds
- Uptime in milliseconds
- Connected clients vs. connected slaves
- Input bytes per second vs. output bytes per second
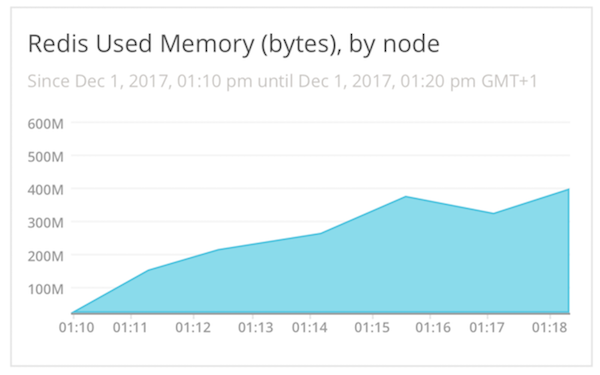
- Memory used
- Changes since last save
- Expired keys per database
- Total number of keys per database
- Average TTL per database in seconds
- Keyspace hits per second vs. keyspace misses per second
- Evicted keys per second vs. expired keys per second
Once you’ve installed and configured the integration, you can find your data in New Relic Infrastructure by navigating from Integrations to On-host integrations and then selecting the Redis integration link.
The integration also comes with pre-built New Relic dashboards that give you quick visibility into available Redis performance and health metrics:
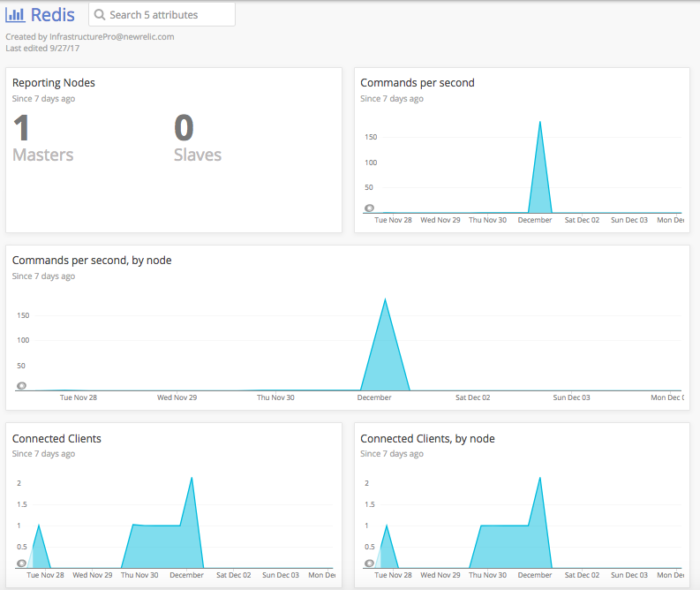
You can create custom queries and custom chart dashboards using Redis data in New Relic Insights, and even combine Redis performance metrics with other integrated systems or application data to surface views meaningful to your business or individual teams. In New Relic Insights, you can find Redis data by querying the RedisSample and RedisKeyspaceSample event types.
Added benefit: Redis inventory data tracking
While knowing how parts of your infrastructure are performing is important, knowing why those parts are performing a certain way is imperative to the success of your business. To this end, New Relic uses the Redis Config Get command to gather inventory data as part of this integration so you can track your Redis inventory and changes to it. If you make configuration changes to your Redis server, those changes are captured as inventory data, which allows you to correlate those changes with performance or reliability concerns.
Check out the Redis integration for yourself
This integration is compatible with Redis versions 3.0 or higher. Installation and activation instructions are available in our docs. Head on over to get started. Also, check out our other integrations like StatsD and Apache.

The views expressed on this blog are those of the author and do not necessarily reflect the views of New Relic. Any solutions offered by the author are environment-specific and not part of the commercial solutions or support offered by New Relic. Please join us exclusively at the Explorers Hub (support.newrelic.com) for questions and support related to this blog post. This blog may contain links to content on third-party sites. By providing such links, New Relic does not adopt, guarantee, approve or endorse the information, views or products available on such sites.


