The software engineering teams using New Relic to measure websites, mobile apps, and critical user endpoints are passionate about efficiency, optimization, and performance. As a result, we receive a lot of customer feedback and feature requests.
In today’s rapidly-changing environments, you want seamless integrations for the technologies and processes you’re already using. Some of your requests have reflected your needs to comply with regional regulations for collecting end-user data, such as General Data Protection Regulation (GDPR) and the need to more easily monitor uptime and performance of critical endpoints within your existing technological ecosystems, such as Kubernetes clusters and React Native applications.
We’ve heard you. And as a result, we have some exciting updates to share about new ways to handle your user data, endpoint monitoring, and mobile applications.
Enable or disable cookie collection in New Relic Browser
If you’re based in Europe—or any area that requires compliance for tracking end-user data online—New Relic Browser now gives you the ability to enable or disable the use of cookies and cookie collection.
Because cookies track user actions, they’re subject to regulation in some regions. Europe’s Privacy and Electronic Communications Regulation (PECR) and GDPR require sites to detail what cookies do, and ask consent from users before placing cookies. In the United States, the California Consumer Privacy Act (CCPA) doesn’t require businesses to gain consent, but it does necessitate disclosure of what companies do with collected data.
New Relic Browser users can now toggle on or off a switch allowing them to determine if they collect cookies by default. This ensures compliance for Browser users when collecting user data.
To learn more, visit our docs page, “New Relic cookies used by Browser.”
Drop noisy or sensitive data from your New Relic Browser agent
Data dropping enables you to drop data at ingest so that it’s not stored in the New Relic Database (NRDB). You have the ability to drop entire data types or subsets and to drop attributes from data types. By dropping data you can:
- More effectively manage cost, choosing to drop data deemed to be low value
- Better handle sensitive data, such as credit card information, social security numbers, or other personally identifiable information (PII)
For more, check out our blog post, "How to Drop Data in New Relic."
Deploy synthetic monitors from your Kubernetes environments
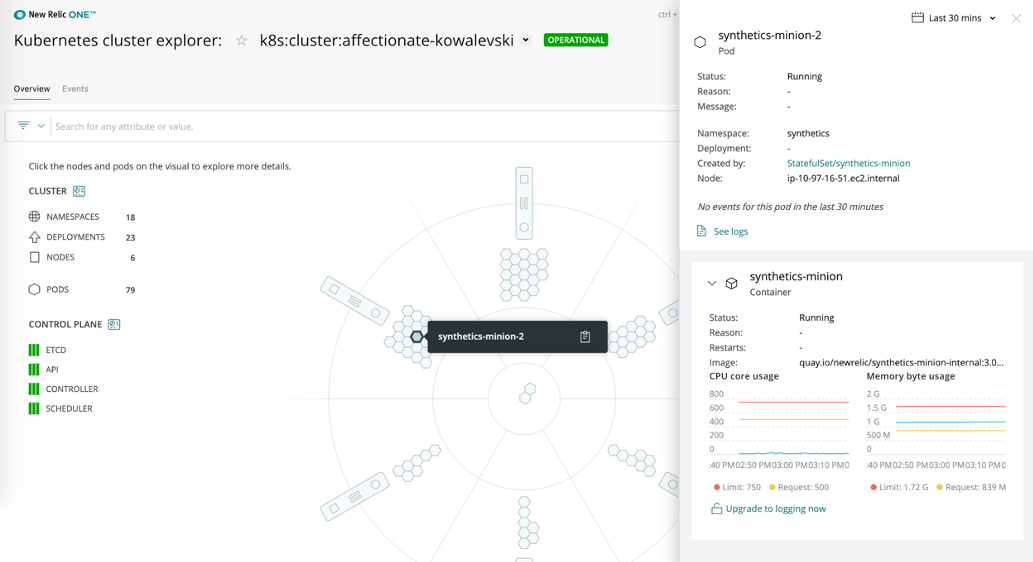
If you missed it, you can now automatically deploy synthetic private locations from Kubernetes environments. This removes the manual process for deploying synthetic tests and helps you easily monitor uptime and performance of employee-facing applications, services, APIs, as well as any critical endpoint existing behind your firewall. As you’re using Kubernetes to build and scale faster, you can easily and automatically combine synthetic tests to ensure coverage as you continuously deliver improvements.
Previously, we launched containerized private minions to help you easily incorporate uptime monitoring into the build process as you tested employee-facing applications behind your firewall.

With our latest update, New Relic Synthetics is meeting you where you are—within the systems you’re using—to automate and manage your build and deployment processes. You now have an easier way to automate and ensure that your critical endpoints are available and performant as you rapidly change and scale your systems. Read this blog post to get started.
More global locations to monitor uptime and performance
New Relic Synthetics is also giving you more locations to choose to measure uptime and performance of your critical endpoints. Previously, we added: Stockholm, Sweden; Hong Kong, China; and Manama, Bahrain. Today we’re excited to announce the availability of Cape Town, South Africa, and Milan, Italy.
With these new additions, you can proactively simulate user traffic to measure uptime and performance from locations closer to your end-users and customers. New Relic Synthetics easily tracks uptime and SLAs for your services, URLs, and API endpoints, and provides performance data on how fast your pages, their resources, and your third-party components take to load.
Optimize React Native application performance
As a reminder, React Native developers can use our open beta React Native agent to monitor their pre-production applications to optimize their performance for stable, fast, and reliable React Native apps.
Previously, React Native developers have been unable to use New Relic Mobile APM because our current agent is built for native frameworks (iOS and Android). As of March 2020, React Native developers can use our open beta React Native agent to monitor their pre-production applications to optimize their performance for stable, fast, and reliable React Native apps.
We’ve received an amazing response for this beta, and don’t want you to miss out. Read more about the open beta, and sign up now.
The views expressed on this blog are those of the author and do not necessarily reflect the views of New Relic. Any solutions offered by the author are environment-specific and not part of the commercial solutions or support offered by New Relic. Please join us exclusively at the Explorers Hub (discuss.newrelic.com) for questions and support related to this blog post. This blog may contain links to content on third-party sites. By providing such links, New Relic does not adopt, guarantee, approve or endorse the information, views or products available on such sites.


