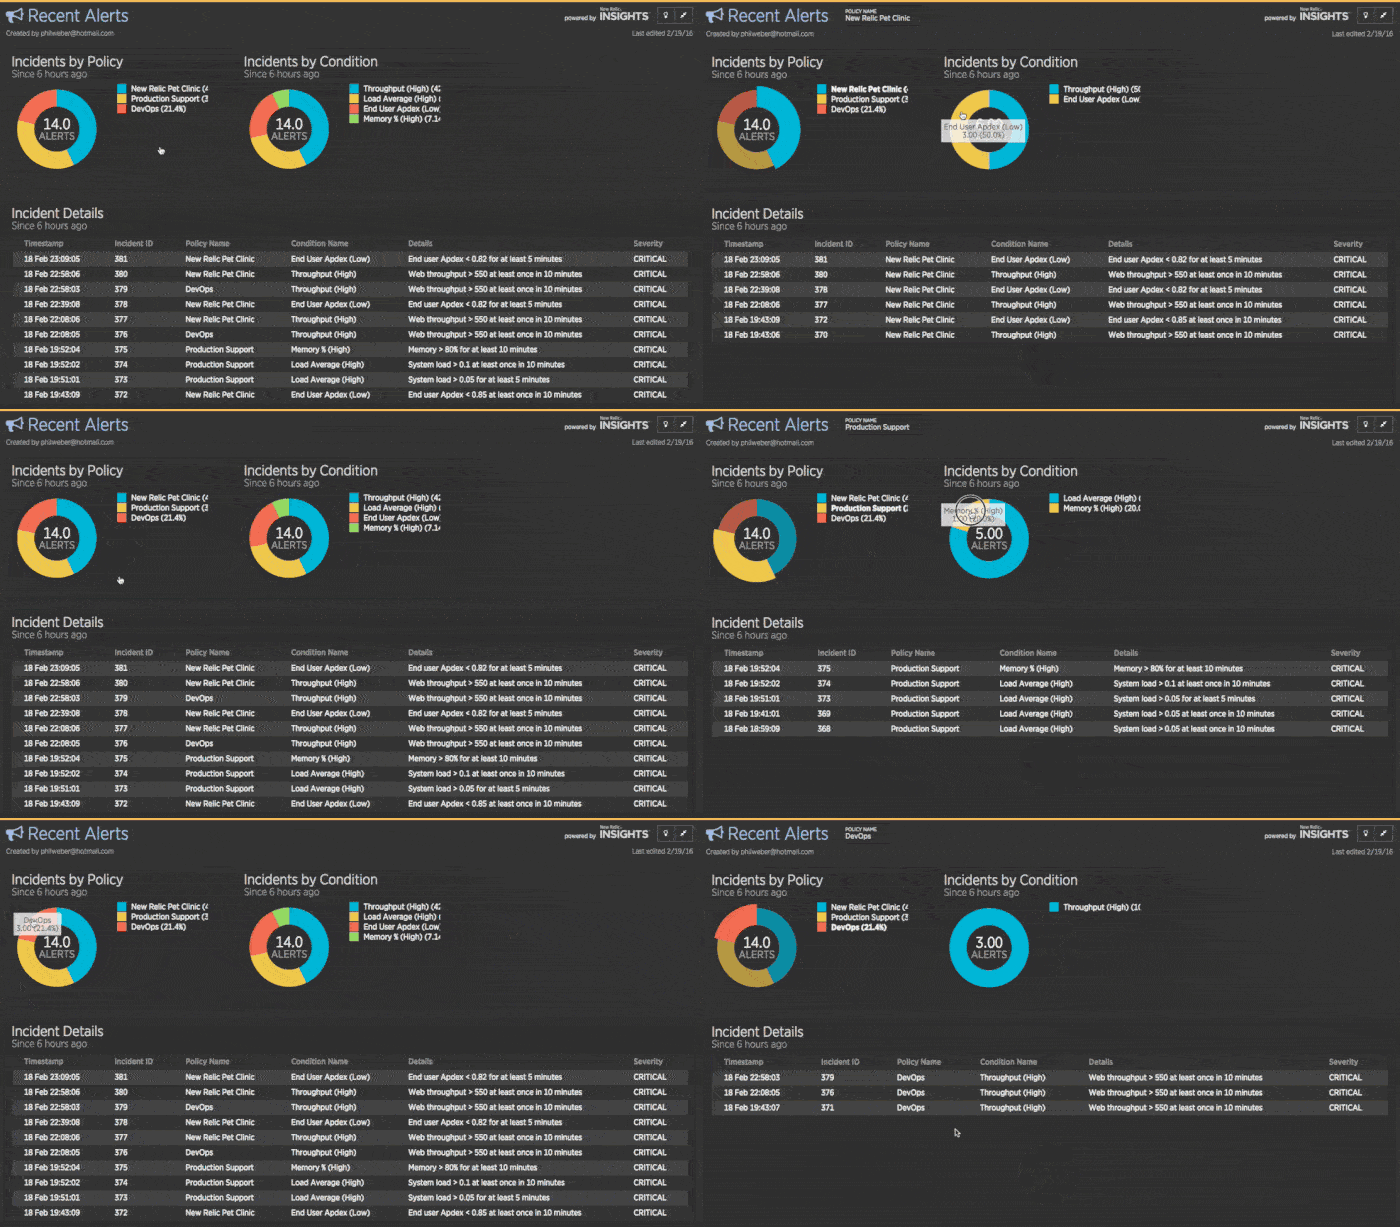
As I was teaching a customer about New Relic Insights recently, she had a light bulb moment: “Ooh,” she asked, “can we use Insights to analyze Alerts data? Can we create a dashboard that shows how many incidents have occurred for each alert policy, and which conditions triggered each incident?”
Good news! It turns out you can do that, and it’s surprisingly easy to set up.
In order to get started, you’ll need the following information from your Insights account:
- An Insert Key for the Insights API
- Your New Relic account ID, which is included in the Insights events API endpoint (https://insights-collector.newrelic.com/v1/accounts/[account_id]/events)
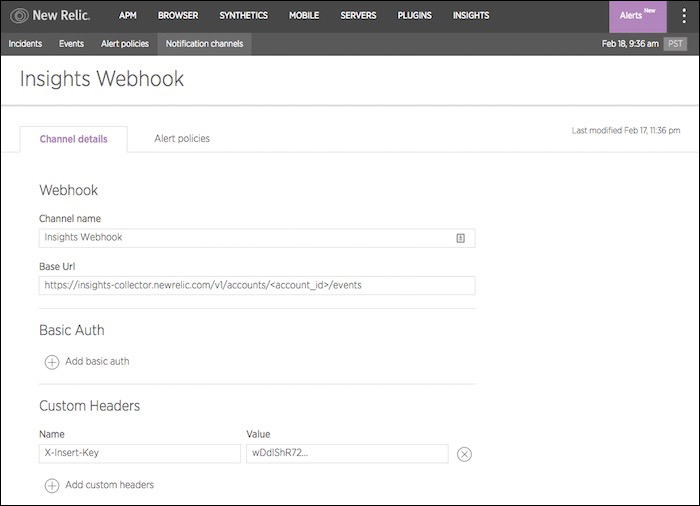
Once you’ve assembled the necessary information, create a Webhook notification channel in Alerts. In the Base Url field, enter the Insights events API endpoint. Add a Custom Header named X-Insert-Key, and set its value to your Insights API Insert Key:

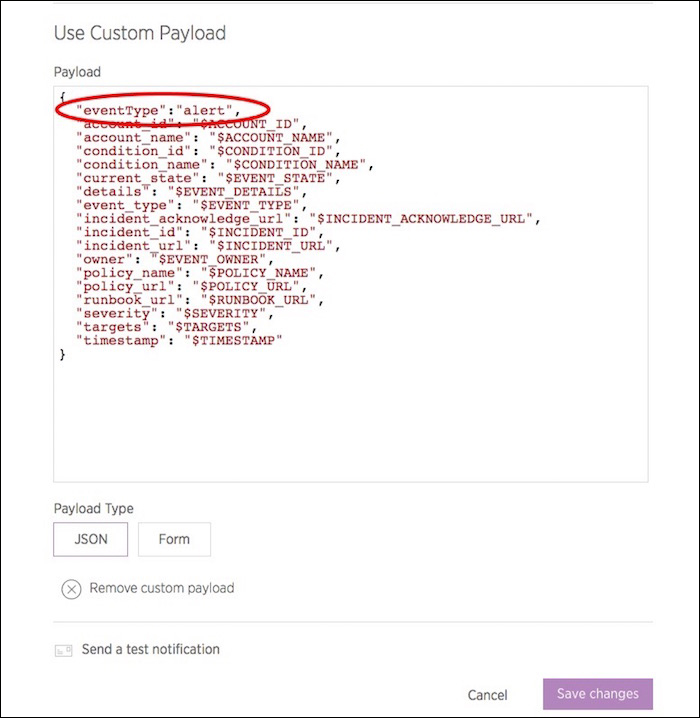
Next, customize the JSON payload that Alerts will send to Insights: add an additional field namedeventType, and specify what you'd like to call your custom Insights event (I called mine alert):

If you like, you can delete or rename attributes (the values to the left of the colons). Save your changes, and associate your new Webhook channel with one or more alert policies.
That’s it! Whenever a condition is violated on one of those policies, Alerts will post the details of the incident to Insights, where you may slice and dice it to your heart’s content.

Note: This blog post was adapted from a post in the New Relic Community Forum. Click here to see the original post and participate in the conversation.
Alert image courtesy of Shutterstock.com.
The views expressed on this blog are those of the author and do not necessarily reflect the views of New Relic. Any solutions offered by the author are environment-specific and not part of the commercial solutions or support offered by New Relic. Please join us exclusively at the Explorers Hub (discuss.newrelic.com) for questions and support related to this blog post. This blog may contain links to content on third-party sites. By providing such links, New Relic does not adopt, guarantee, approve or endorse the information, views or products available on such sites.


