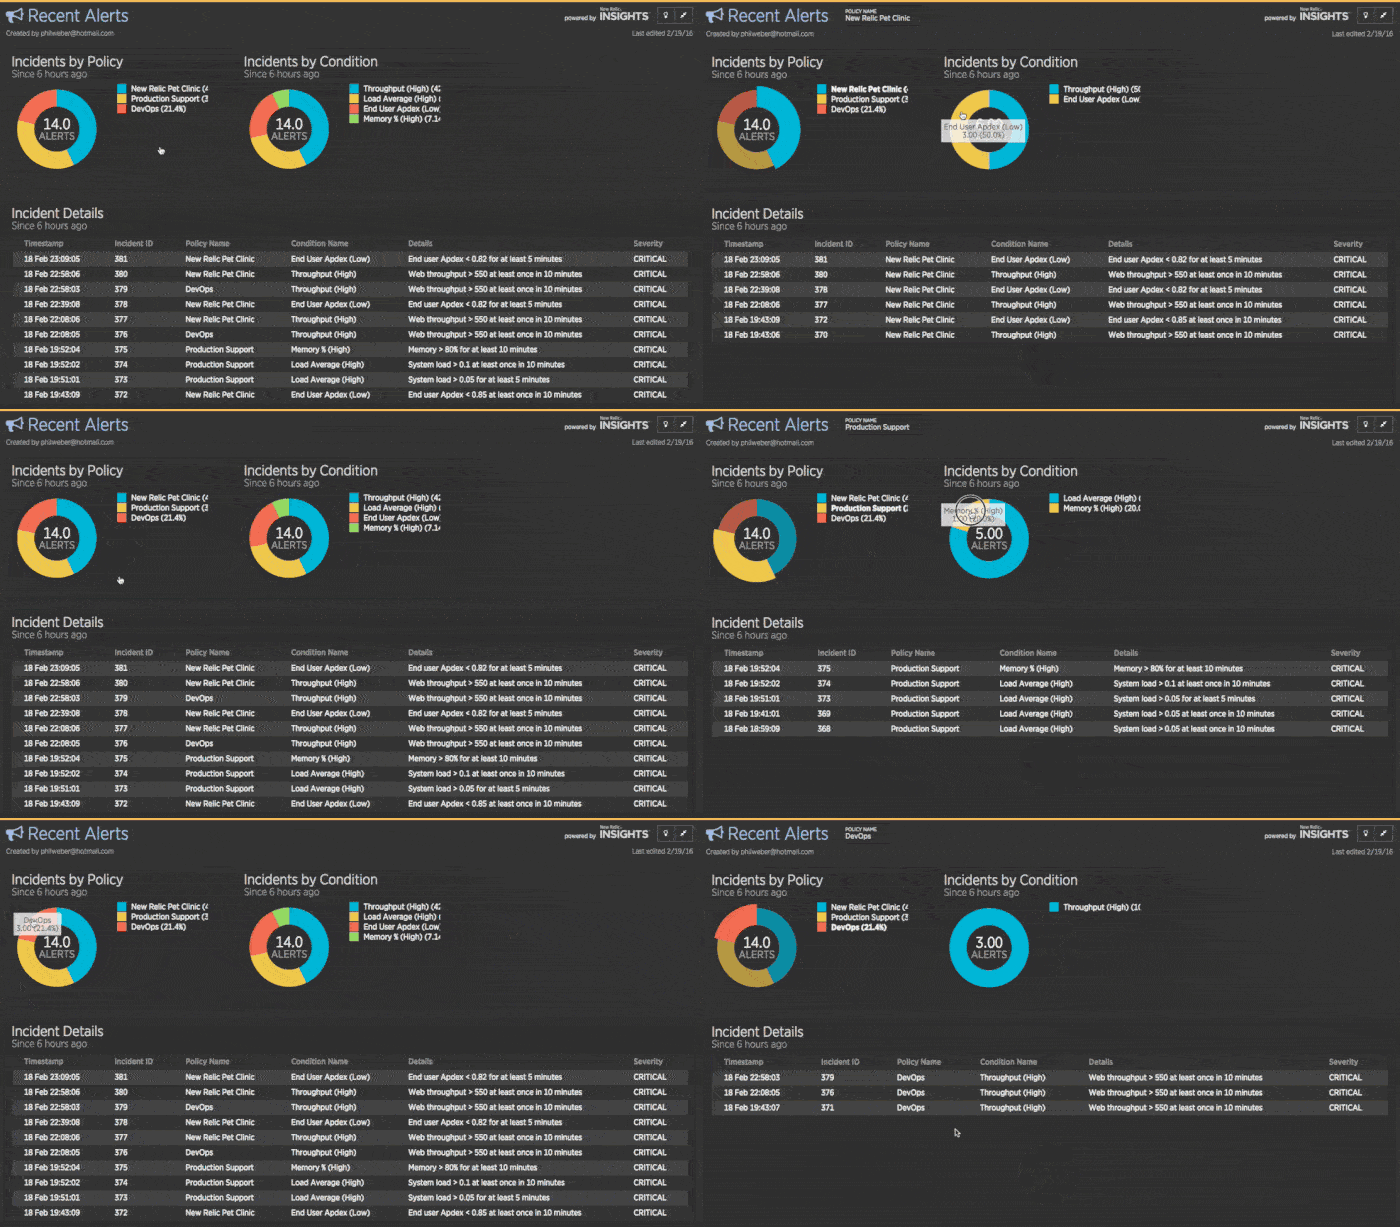
As I was teaching a customer about New Relic Insights recently, she had a light bulb moment: “Ooh,” she asked, “can we use Insights to analyze Alerts data? Can we create a dashboard that shows how many incidents have occurred for each alert policy, and which conditions triggered each incident?”
Good news! It turns out you can do that, and it’s surprisingly easy to set up.
In order to get started, you’ll need the following information from your Insights account:
- An Insert Key for the Insights API
- Your New Relic account ID, which is included in the Insights events API endpoint (https://insights-collector.newrelic.com/v1/accounts/[account_id]/events)
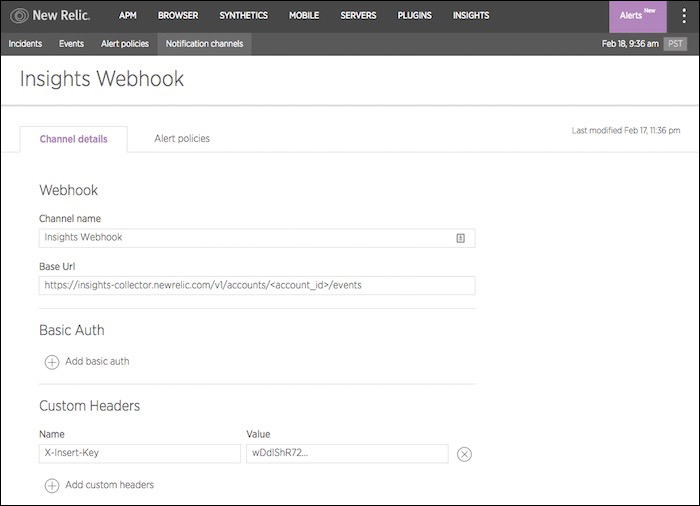
Once you’ve assembled the necessary information, create a Webhook notification channel in Alerts. In the Base Url field, enter the Insights events API endpoint. Add a Custom Header named X-Insert-Key, and set its value to your Insights API Insert Key:

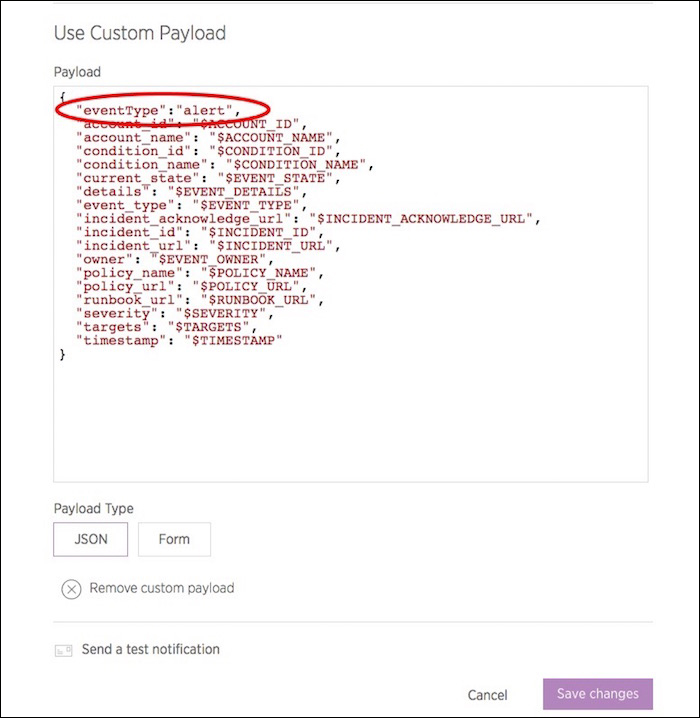
Next, customize the JSON payload that Alerts will send to Insights: add an additional field namedeventType, and specify what you'd like to call your custom Insights event (I called mine alert):

If you like, you can delete or rename attributes (the values to the left of the colons). Save your changes, and associate your new Webhook channel with one or more alert policies.
That’s it! Whenever a condition is violated on one of those policies, Alerts will post the details of the incident to Insights, where you may slice and dice it to your heart’s content.

Note: This blog post was adapted from a post in the New Relic Community Forum. Click here to see the original post and participate in the conversation.
Alert image courtesy of Shutterstock.com.
이 블로그에 표현된 견해는 저자의 견해이며 반드시 New Relic의 견해를 반영하는 것은 아닙니다. 저자가 제공하는 모든 솔루션은 환경에 따라 다르며 New Relic에서 제공하는 상용 솔루션이나 지원의 일부가 아닙니다. 이 블로그 게시물과 관련된 질문 및 지원이 필요한 경우 Explorers Hub(discuss.newrelic.com)에서만 참여하십시오. 이 블로그에는 타사 사이트의 콘텐츠에 대한 링크가 포함될 수 있습니다. 이러한 링크를 제공함으로써 New Relic은 해당 사이트에서 사용할 수 있는 정보, 보기 또는 제품을 채택, 보증, 승인 또는 보증하지 않습니다.


