Every organization manages budgets, tracks progress, and strives for product success. Yet, a significant, often unseen financial drain quietly siphons resources from engineering budgets daily. I call this hidden drain the "Invisible Tax," levied not by governments, but by the very digital systems businesses build and operate—specifically, the parts that are difficult to see into or understand: unobserved systems.
An unobserved system lacks rich, actionable data like detailed logs, granular metrics, and comprehensive traces. Without this essential telemetry, engineers are flying blind when issues arise, forced to guess or manually add temporary logging. These blind spots are where the Invisible Tax flourishes, eroding efficiency and profitability.
It's crucial to differentiate between traditional monitoring and modern Observability. Monitoring tells you if something is wrong (e.g., "Server down."). Observability, in contrast, helps you understand why something is wrong (e.g., "Which API call caused this?"), providing the diagnostic tools to uncover root causes through continuous collection and analysis of logs, metrics, and traces. Observability is a strategic business imperative, transforming operational expenditure into a strategic investment that frees resources for innovation.
The Hidden Costs of Flying Blind
The absence of comprehensive visibility into digital systems imposes a substantial tax that directly impacts budgets and product goals.
The Most Expensive Resource Drain
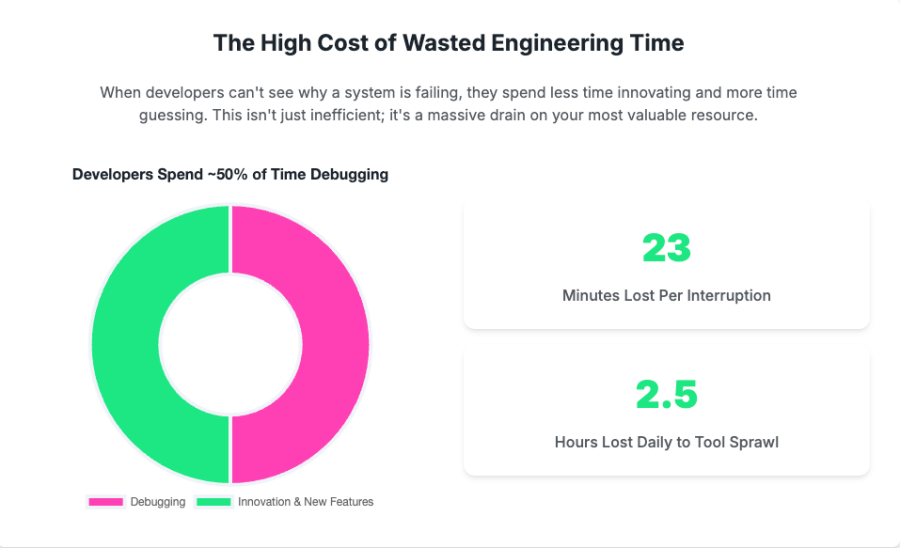
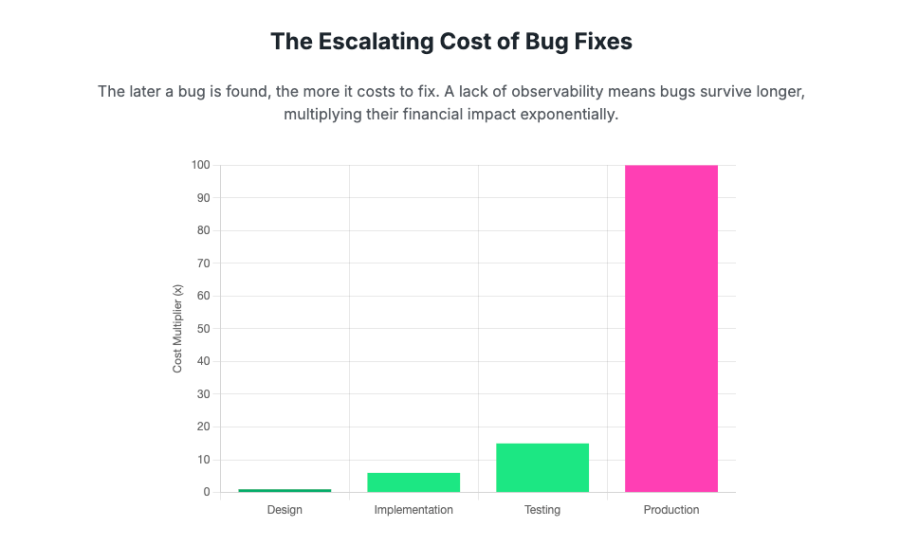
Developers spend approximately 50% of their time debugging. This inefficiency contributes to a multimillion-dollar crisis for the average enterprise annually. Studies show developers can lose an estimated 23 minutes of focus after each interruption, and "tool fragmentation" can waste an additional 2.5 hours daily per developer. The financial burden of fixing software defects escalates dramatically the later they're detected: fixing a bug in production is a staggering 100 times more expensive than fixing it during the design phase. And this diverts highly skilled talent from innovation to reactive firefighting.
The High Price of Downtime
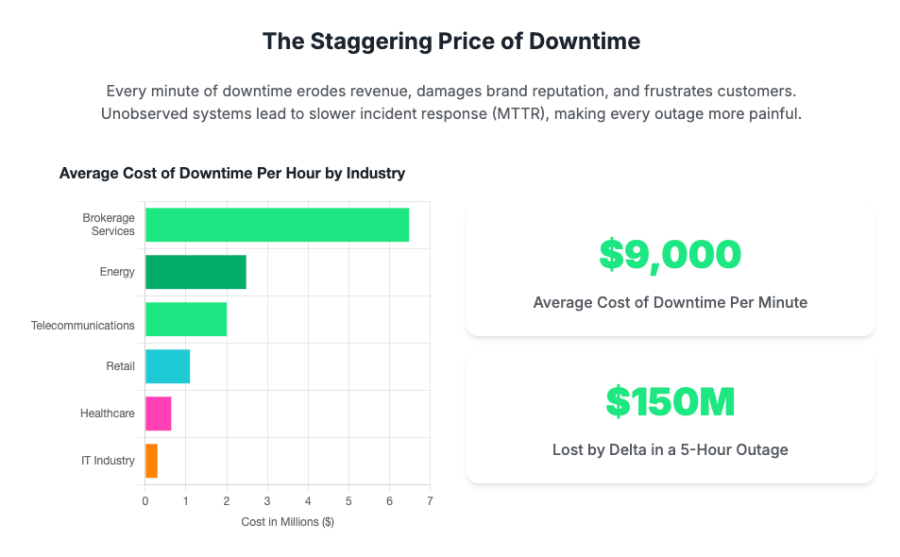
When production systems fail, every minute of downtime carries significant financial and reputational consequences. Unobserved systems dramatically prolong the Mean Time To Resolution (MTTR), leading to increased user churn, substantial revenue loss, and damage to brand reputation.
The average cost of downtime has risen to approximately $9,000 per minute. For larger businesses, this can exceed $16,000 per minute, or $1 million per hour.
Examples of Major Outages:
- Delta (July 2024): The airline lost almost $350+ million due to a faulty Crowdstrike software update.
- Amazon Prime Day (2018): Technical issues due to high traffic prevented many customers from completing purchases, costing Amazon up to $1.2 million per minute in lost sales.
- T-Mobile (2020): A 12–hour nationwide outage, affecting millions, was attributed to equipment failure, network misconfiguration, and a latent software flaw. T-mobile settled a U.S. probe for 19.5 1,000,000 after the outage led to more than 20,000 failed 911 emergency calls.
Misguided Investments and Missed Opportunities
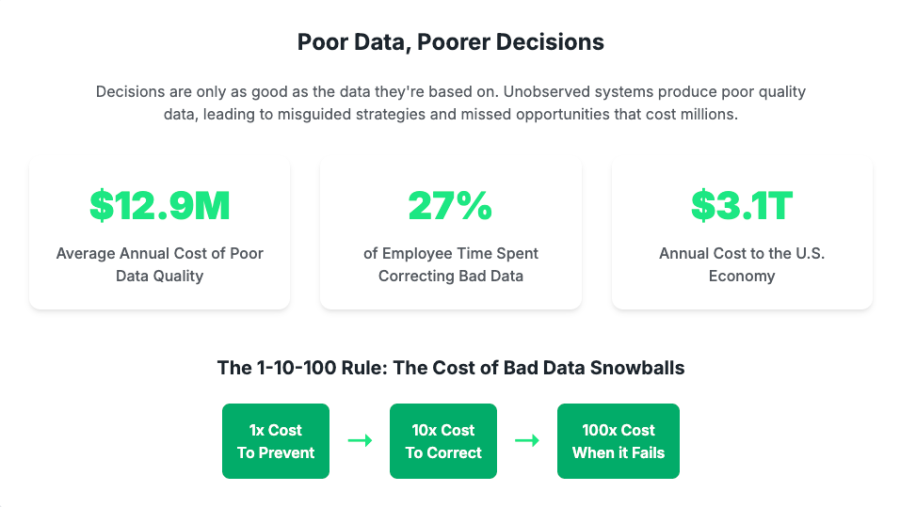
Product leaders rely on accurate data for strategic decisions. However, with unobserved systems, they're "flying blind," unable to truly understand feature performance or user-experienced latency. This risks investing in the wrong areas or being caught unprepared.
Poor data quality, or "data downtime," is a pervasive and costly issue. Gartner estimates it costs organizations an average of $12.9 million annually , with other estimates at $15 million per year. The cumulative impact across the U.S. economy reaches approximately $3.1 trillion annually. The "1x10x100 rule" illustrates this escalating cost: fixing a data quality problem at its point of entry costs 1x, but if it reaches the end-user or decision-making stage, the cost can skyrocket to 100x due to significant business consequences.
Innovation Delayed is Innovation Denied
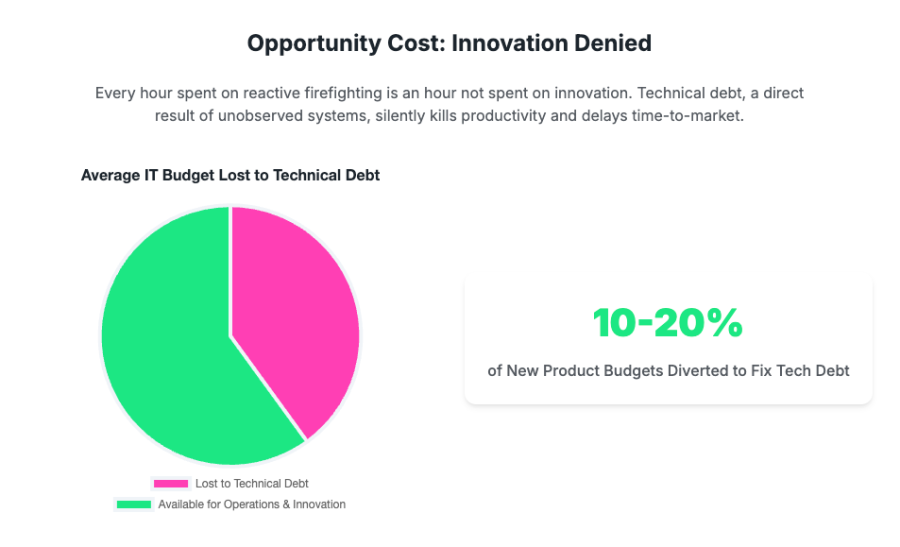
Every cycle an engineering team spends reactively debugging preventable issues is a cycle not spent on developing the "next big thing" or driving innovation.
Technical debt, often arising from unobserved systems and quick fixes, consumes a disproportionate share of IT budgets. A study by Mckinsey found that approximately 40% of an IT department's budget is lost solely to the maintenance and fallout of technical debt, and 10–20% of IT budgets allocated for new product development are instead redirected to address technical debt. Nearly 70% of organizations perceive technical debt as having a high impact on their ability to innovate. This diversion of resources from innovation to maintenance is a critical strategic problem.
The Value of Observability
Organizations don't have to continue paying the Invisible Tax. By strategically investing in Observability, businesses can transform a burden into a powerful engine for velocity, innovation, and sustained growth.
Accelerating Delivery and Reducing Costs
Investing in Observability directly translates to faster debugging, freeing up engineering time for roadmap priorities and accelerating product delivery. It also enables quicker incident resolution by dramatically lowering Mean Time To Resolution (MTTR), minimizing negative impacts on users and the business. Organizations that achieve unified telemetry data experience faster Mean Time To Detect (MTTD) and MTTR, leading to fewer high-business-impact outages. A significant 64% of organizations adopting Observability tools report MTTR improvements of 25% or more.
New Relic Features for Accelerated Delivery and Cost Reduction:
- Response Intelligence: The AI-integrated Issue page provides real-time insights, consolidating incident details, showing "what's impacted," linking past postmortems, and identifying "potential causes" through causal analysis to reduce MTTR.
- Transaction360: Automatically groups and correlates relevant services, telemetry, alerts, and change trackers for each transaction into a single, contextual view, speeding up root cause analysis and enabling proactive issue detection.
Empowering Data-Driven Growth
Observability empowers truly data-driven product decisions, moving beyond subjective assumptions. It provides precise insights into feature usage, performance for different user cohorts, and the real impact of A/B tests. It also contributes to efficient resource allocation by providing visibility into service load and identifying underutilized resources, helping avoid costly overprovisioning.
New Relic Features for Data-Driven Growth and Resource Optimization
- Cloud Cost Intelligence: Offers real-time, comprehensive visibility into Amazon Web Services cloud and Kubernetes resource costs, uncovering insights into cost trends and drivers to empower informed decisions and significant cost optimization.
- Infrastructure monitoring: Provides real-time insights into resource utilization (CPU, network, storage) across cloud and on-premise inon-premises e, supporting effective capacity planning methodologies and preventing costly over-provisioning.
Enhancing Developer Experience and Retention
Developers often spend significant time on mundane, repetitive tasks, or "toil," which detracts from higher-value work and can lead to burnout. Poor software quality and unobserved systems contribute to lower developer productivity and job satisfaction. By streamlining debugging and providing clear insights, Observability directly addresses these pain points, fostering a more positive and productive work environment, improving output, strengthening morale, and reducing costly employee turnover.
New Relic Features for Enhanced Developer Experience and Productivity:
- Service Architecture Intelligence: Consolidates knowledge about digital landscapes into catalogs, scorecards, teams, and maps, directly improving developer productivity by eliminating knowledge silos, accelerating collaboration, and providing clear architectural understanding.
- APM: Simplifies performance monitoring for Kubernetes workloads with no-code instrumentation, providing instant visibility and real-time debugging through intelligent span sampling.
Stop Paying the Tax, Start Investing in Velocity
The "Invisible Tax," levied by unobserved systems, represents a tangible and significant drain on an organization's engineering budget and overall business health. This hidden cost manifests in wasted engineering time, costly downtime from slow incident response, misguided product decisions due to poor data quality, the pervasive opportunity cost of delayed innovation, and increased exposure to catastrophic risks.
To truly stop paying the Invisible Tax and start investing in velocity, product leaders must take decisive action:
- Partner Actively with Engineering: Engage in conversations about Observability, framing it as an enabler of product success.
- Champion the Investment: Advocate for Observability as a strategic investment, highlighting tangible returns like saved debugging time and reduced outage costs.
- Prioritize Observability in Planning: Integrate instrumentation as a fundamental requirement for new features, asking how performance will be monitored and issues troubleshot.
- Focus on Critical Paths Strategically: Prioritize Observability efforts on the "crown jewels" of the business—main user flows, revenue-generating services, or systems causing frequent issues.
- Measure the Impact: Define clear success metrics, such as improvements in MTTR or developer time spent on bug fixing, to demonstrate ROI and justify continued investment.
By embracing these recommendations and leveraging a comprehensive Observability platform like New Relic, organizations can transform operational challenges into strategic advantages. The Invisible Tax can be eliminated, freeing up invaluable resources to drive innovation, accelerate product delivery, and secure a competitive edge in the digital economy.
The views expressed on this blog are those of the author and do not necessarily reflect the views of New Relic. Any solutions offered by the author are environment-specific and not part of the commercial solutions or support offered by New Relic. Please join us exclusively at the Explorers Hub (discuss.newrelic.com) for questions and support related to this blog post. This blog may contain links to content on third-party sites. By providing such links, New Relic does not adopt, guarantee, approve or endorse the information, views or products available on such sites.


