As web developers, we often focus on delivering feature-rich, visually stunning applications. But there’s a hidden layer of complexity that directly impacts the user experience: how assets like images, scripts, and stylesheets are loaded across your application. To illustrate why this matters, let me share a real-world example and show how leveraging the PerformanceResourceTiming API can uncover hidden issues and lead to actionable insights.
The case of the missing images
Imagine this: You’re running an ecommerce platform that entices customers to purchase by showcasing high-quality product images. Everything looks great during development, but customers start complaining that product images occasionally don’t load. Worse, the issue seems inconsistent—some users report problems, others don’t.
You investigate and find that certain images are taking too long to load or failing completely. Without visibility into the performance of individual resources across your application and user base, it’s nearly impossible to pinpoint the root cause. This is where the PerformanceResourceTiming API comes in.
How the PerformanceResourceTiming API works
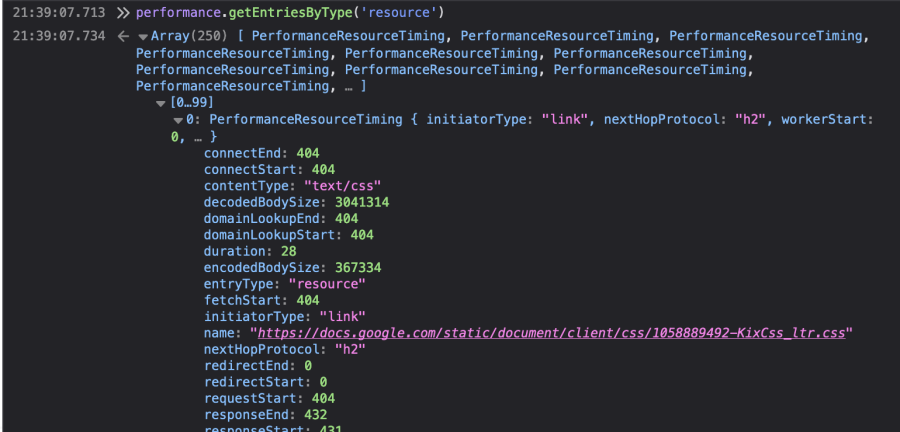
The PerformanceResourceTiming API provides granular details about how resources are loaded in your application. When a browser loads a resource, such as an image or script, it creates an entry in the list. Each entry includes detailed metrics like:
- startTime: When the request for the resource began.
- fetchStart: When the browser began fetching the resource.
- responseEnd: When the resource finished loading.
- duration: The total time taken to load the resource.
- transferSize: The size of the resource after compression.
- initiatorType: The type of resource (for example, “img”, “script”, “css”).
There are many other descriptive timing values. To see this data locally, you can enter “performance.getEntriesByType('resource')” in the developer console of your browser.

Using this data, you can see how long it took to load the resource, where delays occurred, and whether the resource was cached. Some common uses of the data attributes include:
- Measuring TCP handshake time (connectEnd - connectStart)
- Measuring DNS lookup time (domainLookupEnd - domainLookupStart)
- Measuring redirection time (redirectEnd - redirectStart)
- Measuring interim request time (firstInterimResponseStart - finalResponseHeadersStart)
- Measuring request time (responseStart - requestStart)
- Measuring TLS negotiation time (requestStart - secureConnectionStart)
- Measuring time to fetch (without redirects) (responseEnd - fetchStart)
- Measuring ServiceWorker processing time (fetchStart - workerStart)
- Checking if content was compressed (decodedBodySize should not be encodedBodySize)
- Checking if local caches were hit (transferSize should be 0)
- Checking if modern and fast protocols are used (nextHopProtocol should be HTTP/2 or HTTP/3)
- Checking if the correct resources are render-blocking (renderBlockingStatus)
Aggregating performance data across all pages for all users
Now imagine you could collect this data not just for one page but for every page across your application. And not just for one user but for every user on every page. By integrating the PerformanceResourceTiming API with New Relic, you can aggregate resource timing metrics at scale. Here’s how it works:
- Install the browser agent in your web application.
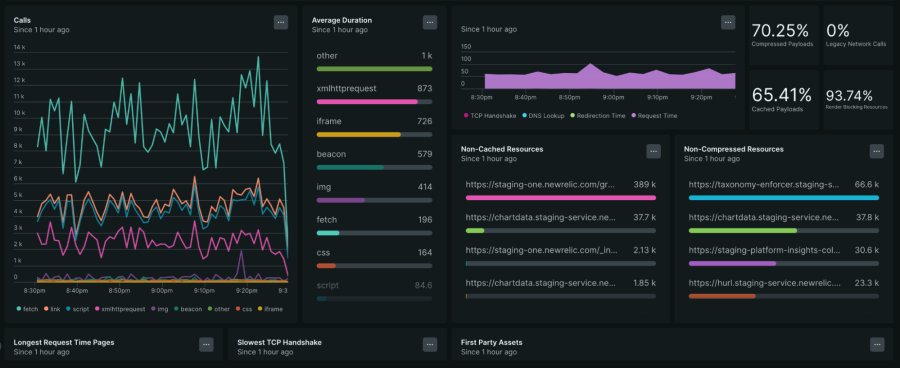
- You can configure the browser agent to collect page resource timing data automatically. Here’s how. By running the New Relic browser agent on all pages of your web application, page resource timing data will be automatically collected as “BrowserPerformance” events.
- Visualize the Insights by visiting your browser entity at one.newrelic.com. Use live, actionable data to visualize metrics like average load time, failed requests, and transfer sizes.
By utilizing the geographic and user data tied to your BrowserPerformance events, and aggregating data across your application for all your end users, you are equipped to discover issues that you would otherwise be blind to.

Fixing the problem
Returning to our example, you utilize the BrowserPerformance event data in New Relic to discover that a certain set of images are loading slowly for all users. By checking the redirection time, you notice that all the images in this set are experiencing redirection delays. You work with your engineering team to get the invalid asset paths replaced with direct paths that do not require redirection.
Even after addressing the redirection issue, another look at the data reveals that images hosted on your CDN are loading significantly slower for users, specifically in Southeast Asia. By analyzing the startTime and responseEnd metrics, you realize the problem lies in the network latency between the CDN’s edge server and the user’s location. Equipped with this data, you work with your CDN provider to enable a closer edge node in that region.
Top takeaways
Tracking asset loading across your application with the power of New Relic provides actionable insights that can transform the user experience. Here’s why you should care:
- Uncover hidden performance issues: Identify specific assets or regions causing slowdowns or failures.
- Improve resource optimization: Spot large file sizes, caching issues, or inefficient delivery mechanisms.
- Drive better business outcomes: A faster, more reliable experience improves user satisfaction and conversions.
Next steps
In today’s competitive landscape, every millisecond counts. By taking a proactive approach to monitoring and optimizing resource performance, you can ensure your application delivers the best possible experience for all users, everywhere. Learn more about installing the New Relic browser agent today.
The views expressed on this blog are those of the author and do not necessarily reflect the views of New Relic. Any solutions offered by the author are environment-specific and not part of the commercial solutions or support offered by New Relic. Please join us exclusively at the Explorers Hub (discuss.newrelic.com) for questions and support related to this blog post. This blog may contain links to content on third-party sites. By providing such links, New Relic does not adopt, guarantee, approve or endorse the information, views or products available on such sites.


