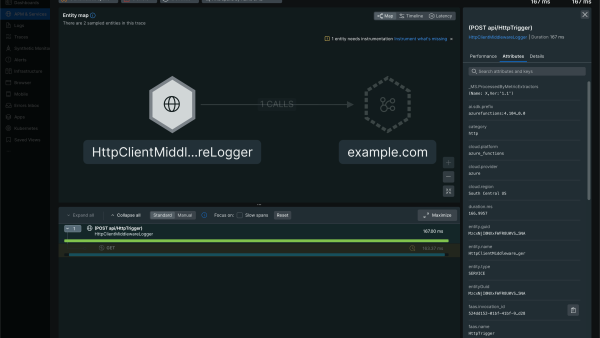
If you use Microsoft Azure to build, deploy, and manage your applications and infrastructure, you need the ability to monitor and optimize the performance of your services. New Relic Azure Monitor integration gives you the ability to pull Azure performance telemetry data into New Relic, giving you a single platform to understand how your entire technology stack is performing, from APM to infrastructure, logs, and more.
Bringing Azure Monitor data into New Relic offers several advantages that enhance your ability to monitor and manage your Azure resources effectively:
- Centralized monitoring: You can get a holistic view of Azure resources and application performance, reducing the need to switch between different monitoring tools.
- Customizable dashboards: Create custom dashboards based on your own needs that combine Azure Monitor data with other metrics collected by New Relic.
- Real-time alerts and notifications: Set up real-time alerts and receive notifications on critical performance issues or incidents affecting your Azure environment.
- Performance optimization: Get deep insights into the performance of Azure-based applications and services, so you can optimize your application stack, identify bottlenecks, and enhance your end-user experiences.
How to deploy the Azure Monitor integration
- Create a New Relic account: If your organization doesn't have a New Relic account, start by signing up for one. The New Relic account will serve as the centralized observability platform.
- Connect to Azure Monitor: In the New Relic portal, navigate to the "Azure Monitor" section by > Infrastructure > Azure > Add an Azure account and configure the integration with Azure Monitor. You'll need to provide your Azure account details to establish the connection. For more information, refer here.
- Enable Azure Monitor integration: To enable this integration, all you need to do is navigate to > Infrastructure > Azure, and look for the Azure Monitor integration. Then click Configure, and toggle Enabled to On. This provides the ability to ingest metrics from all Azure services supported by Azure Monitor. There are other methods available to get metrics from Azure; however, Azure Monitor integration is the preferred way. For more information, refer here.
- Monitor and analyze: After successful integration, New Relic will start receiving data from Azure Monitor. You can now begin monitoring and analyzing your Azure resources alongside other application performance metrics.
Alternatively, use the Azure Native New Relic Service, which enables you to utilize other SaaS services directly on Azure and provides a direct, first-class experience within Azure for integrating with New Relic and sending metrics seamlessly. To set this up, go to the Azure portal and search for “New Relic,” then click on “deploy new resource,” and your telemetry data will begin flowing through into the New Relic platform. For more information, read our docs page.
Azure Monitor best practices
- Define clear objectives: Outline your monitoring objectives and identify key performance indicators (KPIs) that matter most to your business.
- Customize dashboards: Tailor your New Relic dashboards to present data that aligns with your monitoring goals. Use a combination of Azure Monitor data and other relevant metrics to get a complete picture of your environment.
- Configure alerts: Avoid alert fatigue by configuring alerts that focus on critical issues. Use the New Relic intelligent alerting capabilities to avoid unnecessary notifications.
- Periodic review and optimization: Regularly review the performance data and analyze trends to identify areas for improvement. This iterative process will help you continually optimize your Azure environment.
Next steps
Integrating New Relic with Azure Monitor opens up a world of possibilities for organizations leveraging Microsoft Azure. By combining the power of these two industry-leading platforms, businesses can gain comprehensive insights into their Azure resources and application performance. From real-time alerts to custom dashboards, this integration empowers teams to make data-driven decisions, optimize performance, and deliver exceptional user experiences. Embrace this integration and take your Azure monitoring and observability to new heights.
Learn more about the Azure Monitor integration on New Relic Documentation.
The views expressed on this blog are those of the author and do not necessarily reflect the views of New Relic. Any solutions offered by the author are environment-specific and not part of the commercial solutions or support offered by New Relic. Please join us exclusively at the Explorers Hub (discuss.newrelic.com) for questions and support related to this blog post. This blog may contain links to content on third-party sites. By providing such links, New Relic does not adopt, guarantee, approve or endorse the information, views or products available on such sites.


