 Availability monitoring, uptime monitoring, SLA monitoring... no matter what you call it, we've got it. Availability monitoring and reporting is generally available and included with New Relic at no extra charge!
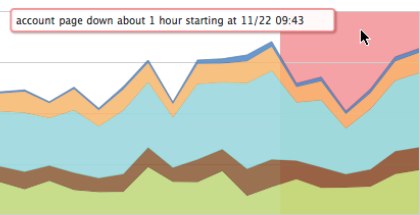
The Availability Monitor pings your application every 30 seconds and alerts you when the application is unavailable for a specified time. So now, if your app goes down, even just for a minute, you'll be able to see that downtime event right alongside your app performance data.
Setting up availability monitoring

Just enter in a URL and you're done!
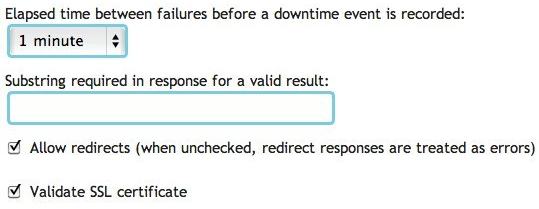
Advanced Options

You can specify a substring for the service to validate against as well as ensure your SSL certificates are valid.
See downtime events integrated with app performance

Get Availability/SLA reporting for your web applications

What was our uptime last month? Now you know! Not only do you see what your availability stats are, but you see them in context with the performance of your application.
If you'd like additional details you can check out the availability monitoring FAQ on our support site. Thanks to the 1k+ customers who participated in our beta program for availability monitoring! This feature is better because of your feedback, so thanks again! Enjoy!
The views expressed on this blog are those of the author and do not necessarily reflect the views of New Relic. Any solutions offered by the author are environment-specific and not part of the commercial solutions or support offered by New Relic. Please join us exclusively at the Explorers Hub (discuss.newrelic.com) for questions and support related to this blog post. This blog may contain links to content on third-party sites. By providing such links, New Relic does not adopt, guarantee, approve or endorse the information, views or products available on such sites.


