 Availability monitoring, uptime monitoring, SLA monitoring... no matter what you call it, we've got it. Availability monitoring and reporting is generally available and included with New Relic at no extra charge!
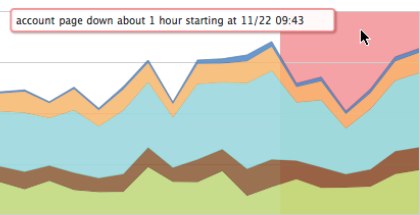
The Availability Monitor pings your application every 30 seconds and alerts you when the application is unavailable for a specified time. So now, if your app goes down, even just for a minute, you'll be able to see that downtime event right alongside your app performance data.
Setting up availability monitoring

Just enter in a URL and you're done!
Advanced Options

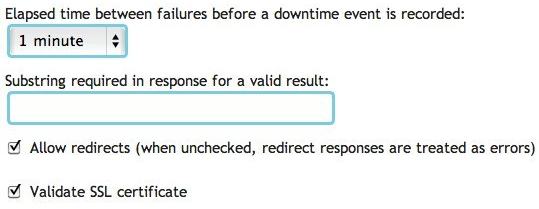
You can specify a substring for the service to validate against as well as ensure your SSL certificates are valid.
See downtime events integrated with app performance

Get Availability/SLA reporting for your web applications

What was our uptime last month? Now you know! Not only do you see what your availability stats are, but you see them in context with the performance of your application.
If you'd like additional details you can check out the availability monitoring FAQ on our support site. Thanks to the 1k+ customers who participated in our beta program for availability monitoring! This feature is better because of your feedback, so thanks again! Enjoy!
이 블로그에 표현된 견해는 저자의 견해이며 반드시 New Relic의 견해를 반영하는 것은 아닙니다. 저자가 제공하는 모든 솔루션은 환경에 따라 다르며 New Relic에서 제공하는 상용 솔루션이나 지원의 일부가 아닙니다. 이 블로그 게시물과 관련된 질문 및 지원이 필요한 경우 Explorers Hub(discuss.newrelic.com)에서만 참여하십시오. 이 블로그에는 타사 사이트의 콘텐츠에 대한 링크가 포함될 수 있습니다. 이러한 링크를 제공함으로써 New Relic은 해당 사이트에서 사용할 수 있는 정보, 보기 또는 제품을 채택, 보증, 승인 또는 보증하지 않습니다.


