 Availability monitoring, uptime monitoring, SLA monitoring... no matter what you call it, we've got it. Availability monitoring and reporting is generally available and included with New Relic at no extra charge!
The Availability Monitor pings your application every 30 seconds and alerts you when the application is unavailable for a specified time. So now, if your app goes down, even just for a minute, you'll be able to see that downtime event right alongside your app performance data.
Setting up availability monitoring

Just enter in a URL and you're done!
Advanced Options

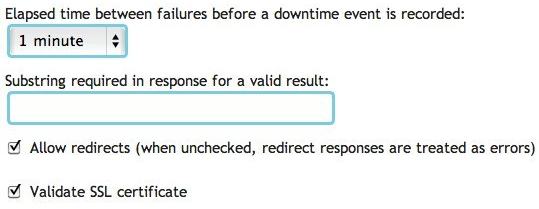
You can specify a substring for the service to validate against as well as ensure your SSL certificates are valid.
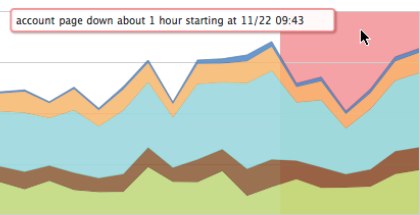
See downtime events integrated with app performance

Get Availability/SLA reporting for your web applications

What was our uptime last month? Now you know! Not only do you see what your availability stats are, but you see them in context with the performance of your application.
If you'd like additional details you can check out the availability monitoring FAQ on our support site. Thanks to the 1k+ customers who participated in our beta program for availability monitoring! This feature is better because of your feedback, so thanks again! Enjoy!
本ブログに掲載されている見解は著者に所属するものであり、必ずしも New Relic 株式会社の公式見解であるわけではありません。また、本ブログには、外部サイトにアクセスするリンクが含まれる場合があります。それらリンク先の内容について、New Relic がいかなる保証も提供することはありません。


