Modern Software Drives Innovation
Most SaaS companies today will tell you there’s never been a better time to build and deliver software. New technologies such as cloud, microservices, and containers give you greater scale and efficiency. DevOps, CI/CD, and automation will all increase your developers’ speed and agility—which all points to faster innovation than ever before.
That’s the promise, right?
Your reality is likely a bit different. As your IT team has pursued cloud modernization and deployment speed and scale, your IT stack has become increasingly complex. And there’s a lot more for you to monitor and watch over, such as:
- Hybrid environments across multiple cloud vendors
- A wider surface area of technologies, all delivering different types of telemetry data
- More frequent software changes—an increasing number of organizations report at least dozens of deploys per week
- Distributed teams whose speed of deployment and innovation all hinge on having visibility into different parts of the stack, even those parts they didn’t develop and deploy
- An ever-expanding set of monitoring tools, some of which are added as you hire new developers, each guarding their precious tools like they would a magic ring.
All this means that, as ecosystems continue to expand and become increasingly complex, it’s more critical than ever to be able to see across your entire software system with full context and data correlation. Because unless you do, you’ll likely curse every software company that tells you, “There’s never been a better time to build and deliver software.”
This white paper aims to help you get there—we’ll outline the challenges that tool sprawl introduces and show you how a modern approach to monitoring and complete end-to-end observability can tame the complexity and keep us all honest.
Tool Sprawl Is Real
To keep up with IT complexity, teams are adopting new monitoring tools—both proprietary and open source—at a rapid pace. The average organization enlists dozens of tools across distributed teams to monitor different parts of their stack. And instead of helping you innovate faster and improve mean time to detect (MTTD) and mean time to resolution (MTTR), tool sprawl generates an onslaught of new problems, including:
- Data silos that result in blind spots
- Increased toil from switching between tools while your teams are under pressure to troubleshoot issues
- A lack of data correlation between disconnected toolsets
- Increased MTTD and MTTR
- Point solution lack of scalability and reliability
- High costs and licensing friction associated with commercial tools limits widespread deployment and system visibility
- Hidden costs associated with managing open source monitoring tools
And while you would never have designed it this way from the start, this picture has evolved organically with time and compromise. A piecemeal approach can’t keep up with the demands your customers are putting on your business. In short, tool sprawl makes observability impossible.
This problem goes far beyond the effects of technology. Remember that you adopted these new technologies and monitoring tools for a reason: to empower your developers with the tools they need to develop, deploy, and innovate faster, all in the name of supporting business imperatives and staying competitive. But this piecemeal approach to monitoring is directly at odds with these business goals. Tool consolidation—or more realistically, “tool rationalization”—is the antidote to these problems. It’s all about getting you to a state of observability so you can support business objectives.
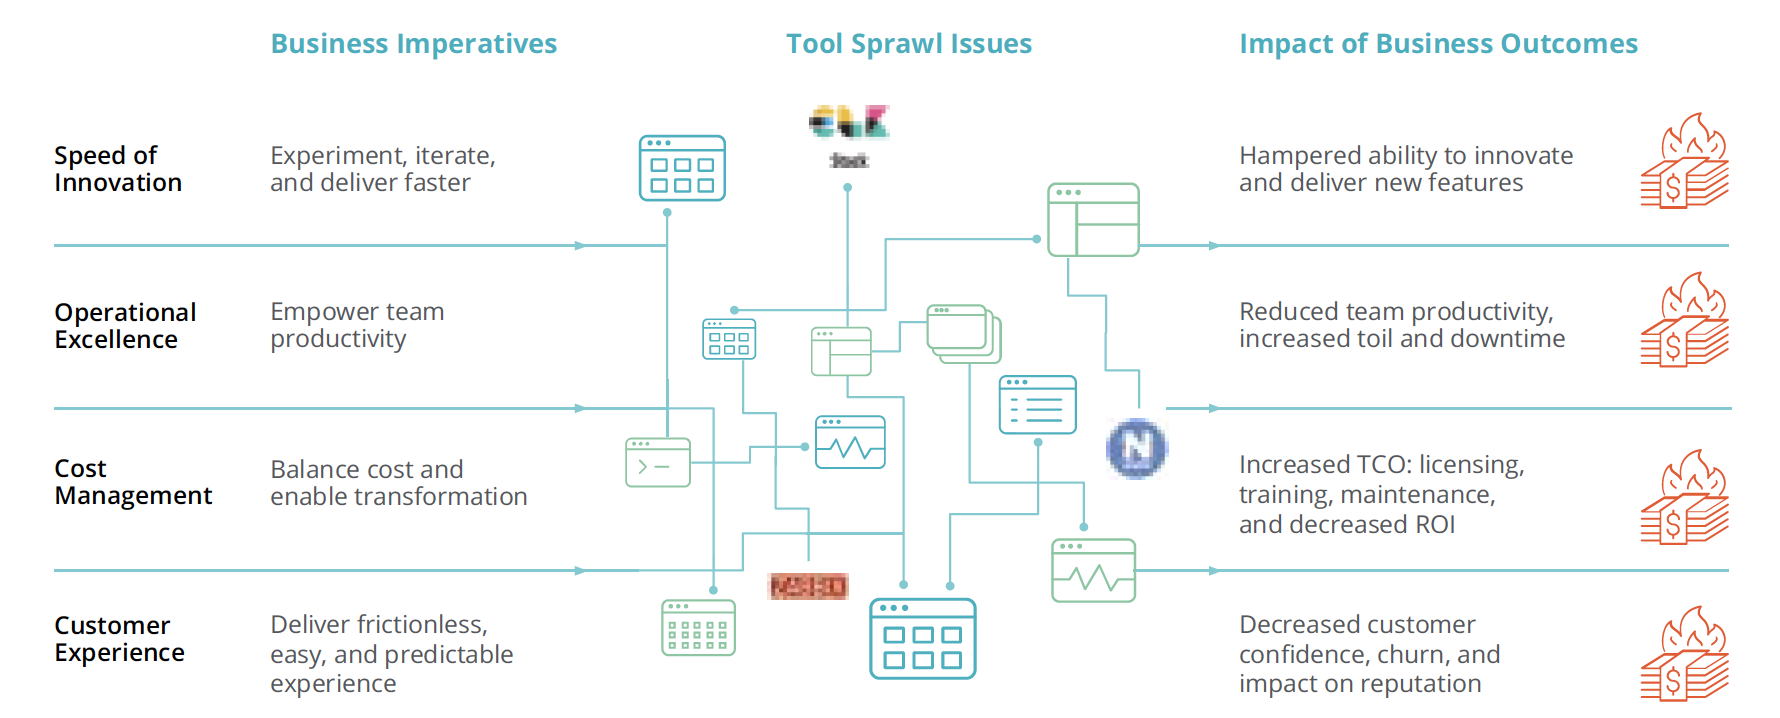
Tool Sprawl Sabotages Business Imperatives
It’s Time to Modernize Your Approach to Monitoring
By adopting DevOps and embracing agile over waterfall development, software teams can release more software faster than ever. Likewise, legacy operations models meant you predominantly deployed monoliths to on-premises infrastructure; but with increasing cloud adoption, you’ve moved to building microservices deployed in containers across hybrid environments, enabling more innovation and better customer experiences. And just as you’ve updated the way you build software, you now need to modernize your approach to monitoring that software.
When you get stuck in the legacy model of managing many scattered “best-of-breed” point solutions, you put out the welcome mat for complexity. It’s inefficient, saps productivity, increases downtime, results in data silos with limited to no context, and results in poor customer experiences that allow competitors to get ahead.
You need to rethink how you monitor these dynamic systems, as 451Research and S&P Global Market Intelligence found in their “Monitoring: It’s Time for a Change” analyst report. The research, which New Relic sponsored, surveyed 700 IT decision makers, and only 11% said they were satisfied with their current monitoring platforms. A full 83% are actively seeking new monitoring tools or have plans to expand or improve their approach to monitoring. That’s where observability comes in.
In a reality where your software’s health equals better customer experiences and healthier business outcomes, observability gives your developers the confidence to move fast and the visibility to understand the entire system’s health in one place. Observability enables you to have:
- A single source of truth for monitoring data
- The ability to break down data silos and solve issues faster
- A clearer understanding of why issues occur, for higher productivity
- And ultimately, the ability to make better data-driven business decisions
Observability Requires Everything in One Place
So what’s needed for observability? First and foremost, it starts with visibility to ingest, see, query, and gain insights from all telemetry data from any source—even open source tools—in one place. An observability platform should enable you to:
- Ingest, analyze, and alert on all your metrics, events, logs, and traces from any source
- Easily visualize and troubleshoot your entire software stack in one connected experience
- Detect, understand, and resolve incidents faster with artificial intelligence for IT Operations (AIOps)
As with any data, it’s not about just the ability to collect that data, but notably, the power to cross-correlate it to garner insights. Your observability platform should surface automatic connections across all the data—regardless of the telemetry type or where that data was generated in the stack. Seeing how applications that you and your teammates developed affect container health gives you the insights needed to pinpoint issues faster, understand what caused the issue, and why, so you can proactively optimize your digital business.
Your Tool Consolidation Road Map
Because observability requires data to be ingested, analyzed, and cross-correlated all in one place, the natural next step is to assess and rationalize your existing toolset. Inventory what you have, who’s using the tools, what you’re gaining from them, and then prepare for and execute a modernization process.
A proven and repeatable methodology to achieve modernization necessitates collaboration in consolidating and rationalizing monitoring tools across business units to reduce costs, improve MTTD and MTTR, improve knowledge sharing, and increase business velocity.
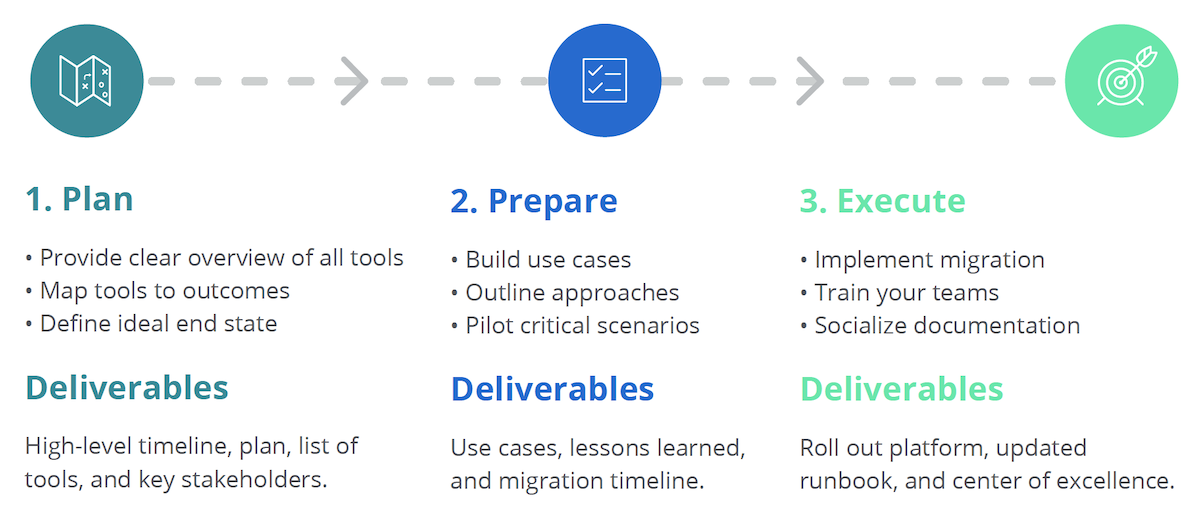
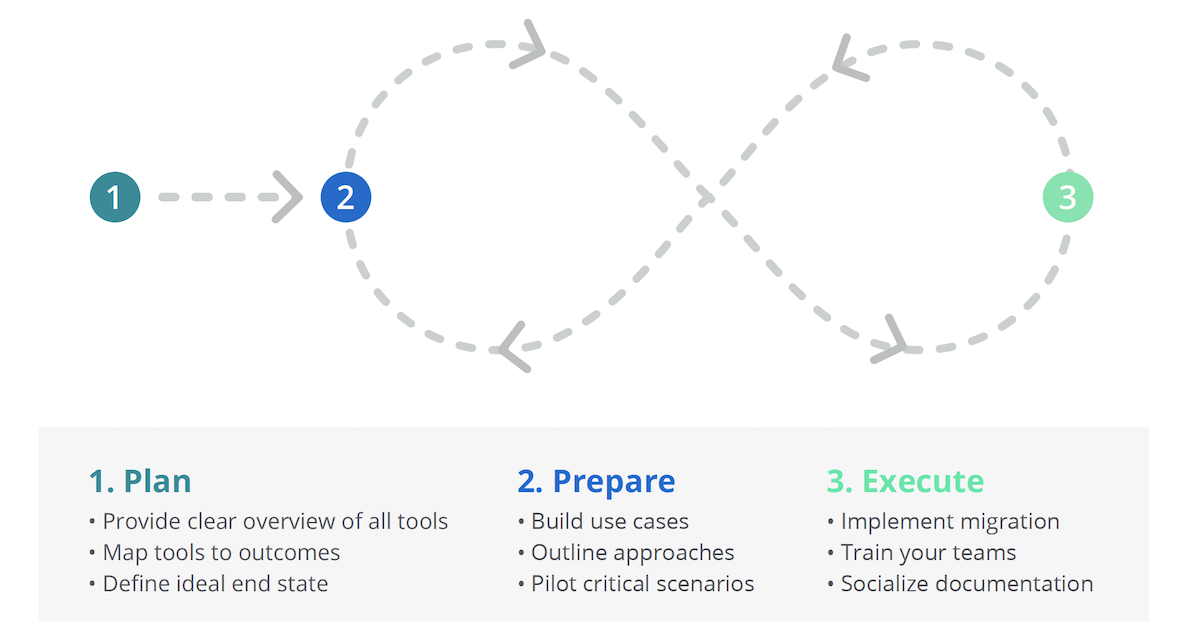
A Three-Phased Approach for Successful Tool Rationalization: Plan, Prepare, and Execute
Phase 1: Plan
During the Plan phase, you want to gain a clear overview and understanding of:
- All tools in your organization
- The objectives you want to achieve, for example:
- Better team productivity and collaboration through tool consolidation
- Reduced time to find and resolve issues by reducing tool complexity
- Reduced costs for tool licencing, training and maintenance
- A clear, understandable architecture diagram
- KPIs to track throughout the migration
The key deliverables for this phase are:
- High-level timeline and scope of the migration
- Understanding and cooperation among the teams and business units involved
- List of tools in use today, including names of stakeholders and economic buyers
- Agreed-upon architecture of the current and future environment
During discovery, it’s important to inform each business unit of the exercise’s goals and the work that will be required.
For each tool used within the organization, a map will show:
- Which teams are using each tool, along with the level of usage and knowledge requirements
- How each tool is used, and which critical KPIs it brings forward
- How each tool integrates into the incident management process
- How tools are interconnected and how events or incidents propagate through the environment
- What each tool costs and when the next renewal cycle is planned
- Which KPIs are critical, and how they connect to the monitored services
After each business unit has mapped its tools and high-level requirements, meetings with each unit cover the following:
- What are the critical KPIs and services monitored?
- Is each critical? Might they be replaced or monitored differently?
- Is a replacement required for each tool, or are there redundancies across your toolset (meaning consolidate immediately without any meaningful impact)?
- Further map out key functionalities and integrations for the remaining tools
Gathering this data early on will help cross-organizational teams align on priorities and select key use cases that new solutions will enable.
In parallel, it’s important to create an architecture of the environment and define an ideal future state:
- Which incident management tools do you currently have in place, and do they satisfy your requirements?
- How do incidents and alerts currently flow through your environment?
- Are tools shared between teams and business units?
- Which teams or business units need to be informed of which type of incident?
- What are the key complaints or improvement requests coming from your support organization?
- What changes do you have to make to optimize your MTTD and MTTR?
Once you’ve defined an ideal future state, you can create an architecture diagram representing it.
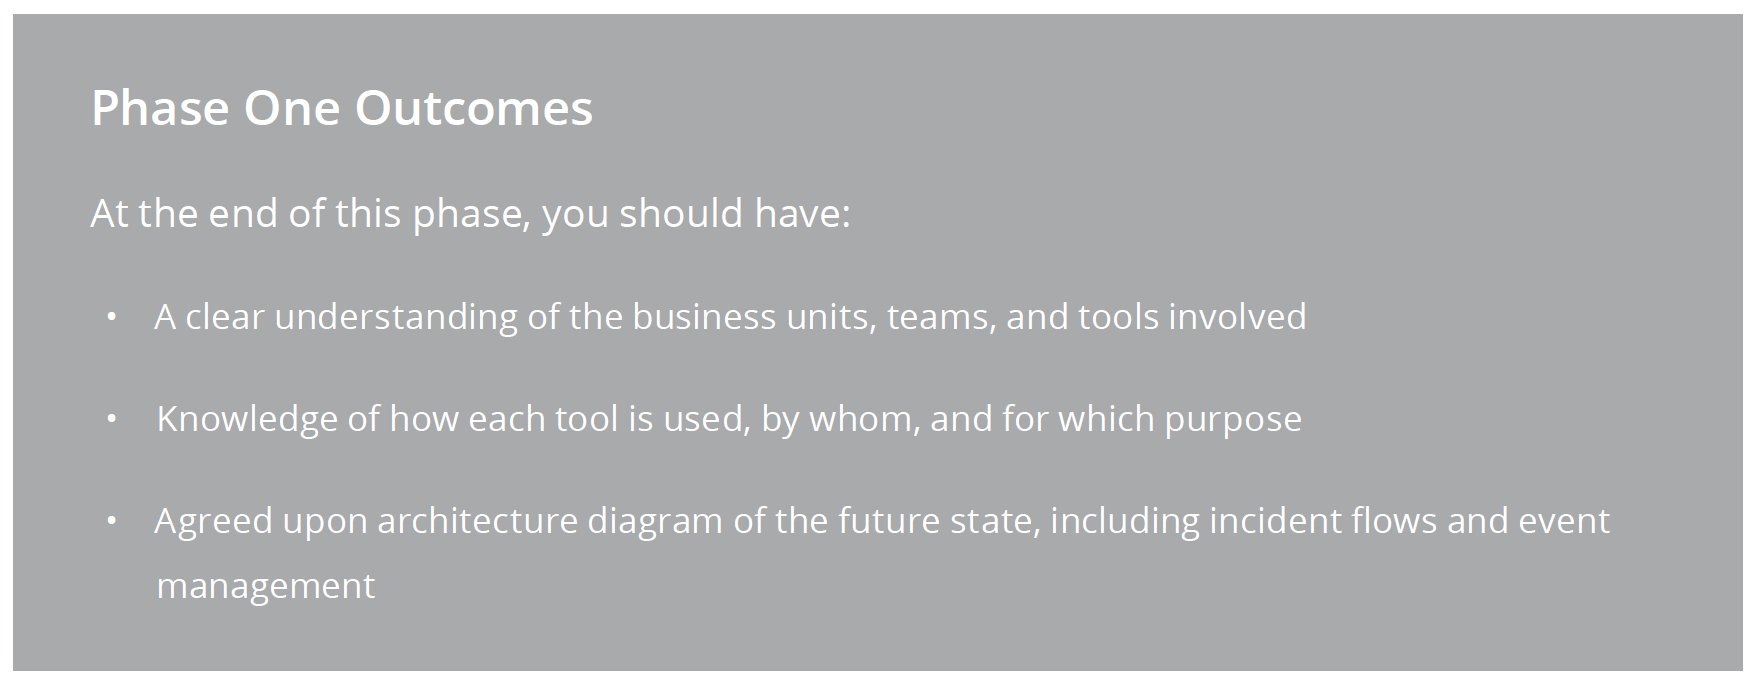
At the end of this phase, you should have:
- A clear understanding of the business units, teams, and tools involved
- Knowledge of how each tool is used, by whom, and for which purpose
- Agreed upon architecture diagram of the future state, including incident flows and event management
The business units involved should be fully invested and appoint key stakeholders to an allocated team for the consolidation exercise.
Phase 2: Prepare
The Prepare phase sets you up to execute the rationalization effort by building a comprehensive set of use cases, outlining possible solutions for them, and then testing critical scenarios as needed. In this phase, it’s essential to map high-level objectives and not technical capabilities.
For example, “We require metric CPU, memory, connections, and queries per second.” This isn’t an open use case, as the requirement is limited by the scope of an existing solution. Rephrasing the use case to, “We require visibility into the health and performance of our database instances” describes the need in a way that invites other solutions.
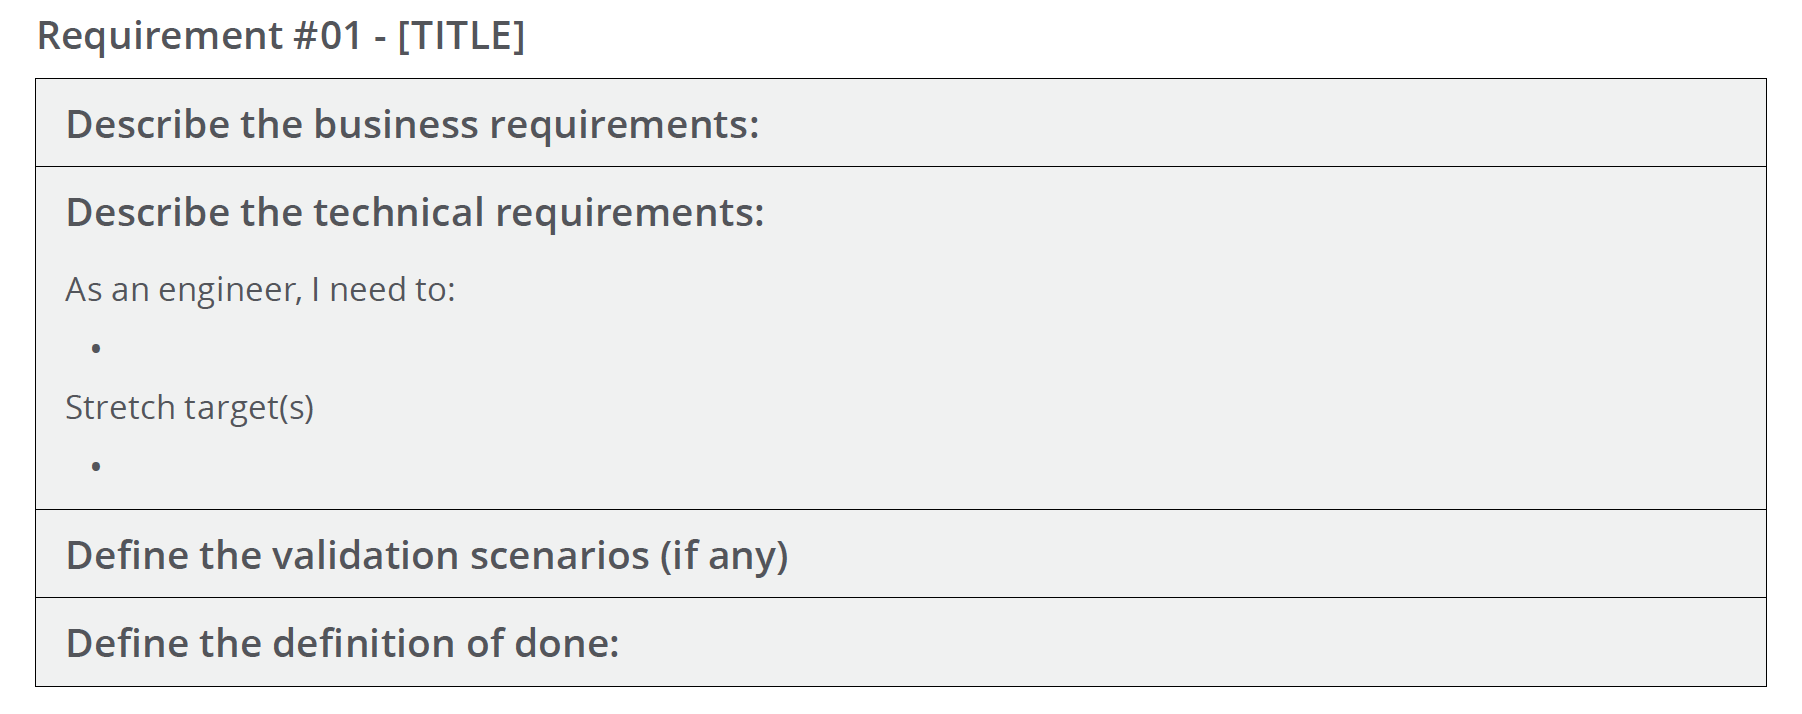
The next steps are to:
-
Map each functional requirement to an overarching use case. You can group functionalities and create use cases around them.
-
Build a consolidated list of use cases with a set of tools that enable them
-
Test specific use cases against solutions for verification
The result of this exercise is to identify use cases that are enabled by specific tools. From there, you can create a migration plan.
Your map will include objectives over multiple cycles, beginning with easy-to-migrate environments and ending with more challenging environments, where full visibility into the current setup might not exist.
Initial cycles focus on building an Observability Center of Excellence and mapping out the company standards. A sample observability center of excellence looks like this.
Phase 3: Execute
During the Execute phase, it’s time to apply the agreed-upon decisions from the Prepare phase. As much as possible, implement all changes required to consolidate your tools, which means:
-
Implementing changes and deploying these to testing, staging, and eventually production
-
Training teams on the new platform and making sure they have the right knowledge for day-to-day operations
-
Implement the alerting and event management strategy described in the Plan phase
-
Document and share any experience that could be useful in further phases
Your teams can use their preferred methodology to plan the migration work, as long as the Execute phase itself is completed in an agreed upon timeline.
When the execution is finished or the time limit has been reached, the teams gather to perform a retrospective to discuss progress, improvements, and next steps. This information is collected and used again in an iterative migration process.
This cycle is continued until the environment is wholly migrated, and you have achieved the agreed-upon goals.
Conclusion
Partnering with New Relic for tool consolidation enables you to save time, lower costs, increase productivity, and reduce capital expenditures. With our methodology, your teams will get unified visibility, predictable and straightforward pricing, and support from our Expert Services team to guide you along the way.
Reduce complexity and improve collaboration by partnering with New Relic on your tool consolidation initiative. Unlock savings and improve efficiencies so your teams can focus on innovation and maximizing customer value. You can read more here about one company’s success.
If you're considering a tool consolidation project, contact one of our experts today who can guide you step-by-step through the entire process.


