Gain more uptime. Bring costs down.


- Easily access daily insights with one view of your full stack.
- Know app health in a snap and quickly spot emerging trends.
- Get real-time user insights to improve customer experiences.
- Instantly see instrumentation gaps, and say bye to blind spots.
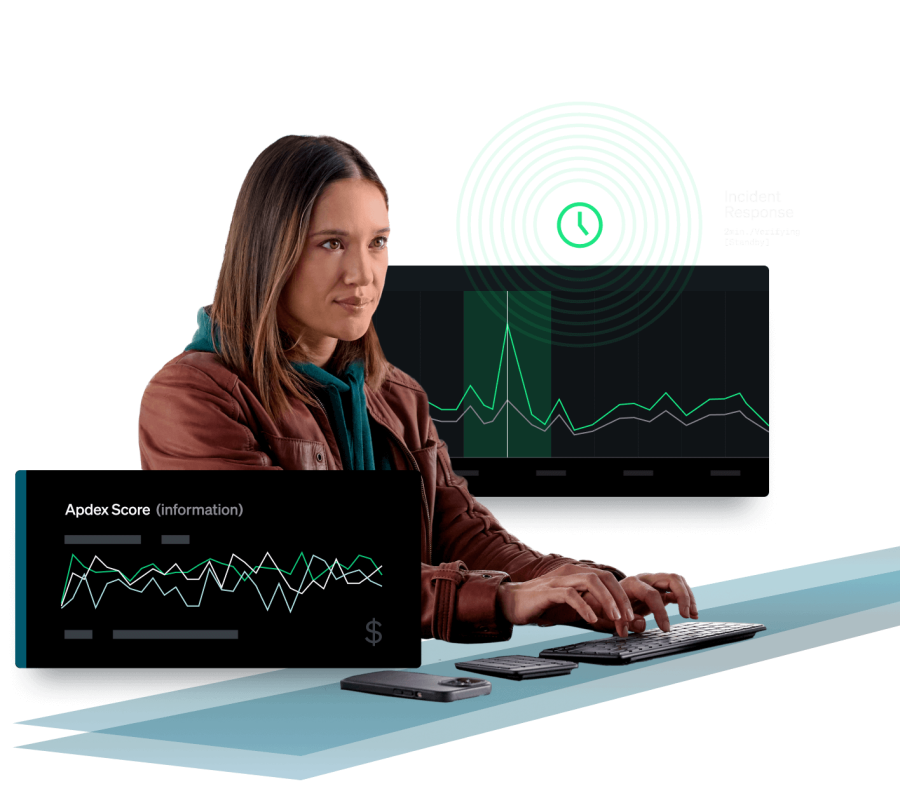
Get a unified view of your application health.
APM in context.
- Go beyond incident troubleshooting with daily insights on performance, security, and development.
- Optimize performance across your entire stack in one unified user experience.
- View logs, infrastructure, apps, tracing, serverless, and end-user experience together, in context—no tool switching.

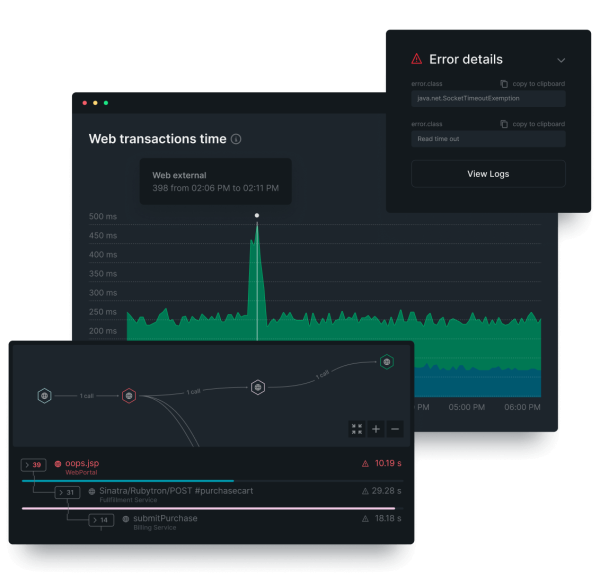
Deploy fast. Troubleshoot hidden errors in minutes.
- No complex configuration or hardware to maintain. Just sign up for free, ingest data, and start monitoring.
- Auto-instrumentation and curated views means no stand up servers, stitched together tools, or sifting through logs.
- Detect anomalies, discover deficiencies, and improve on key metrics that are crucial for your business.
- Query-based analytics and customizations help you stay on top of the complex issues in your app environment.
Look who
has us open.
has us open.

