What's included?
dashboards
1
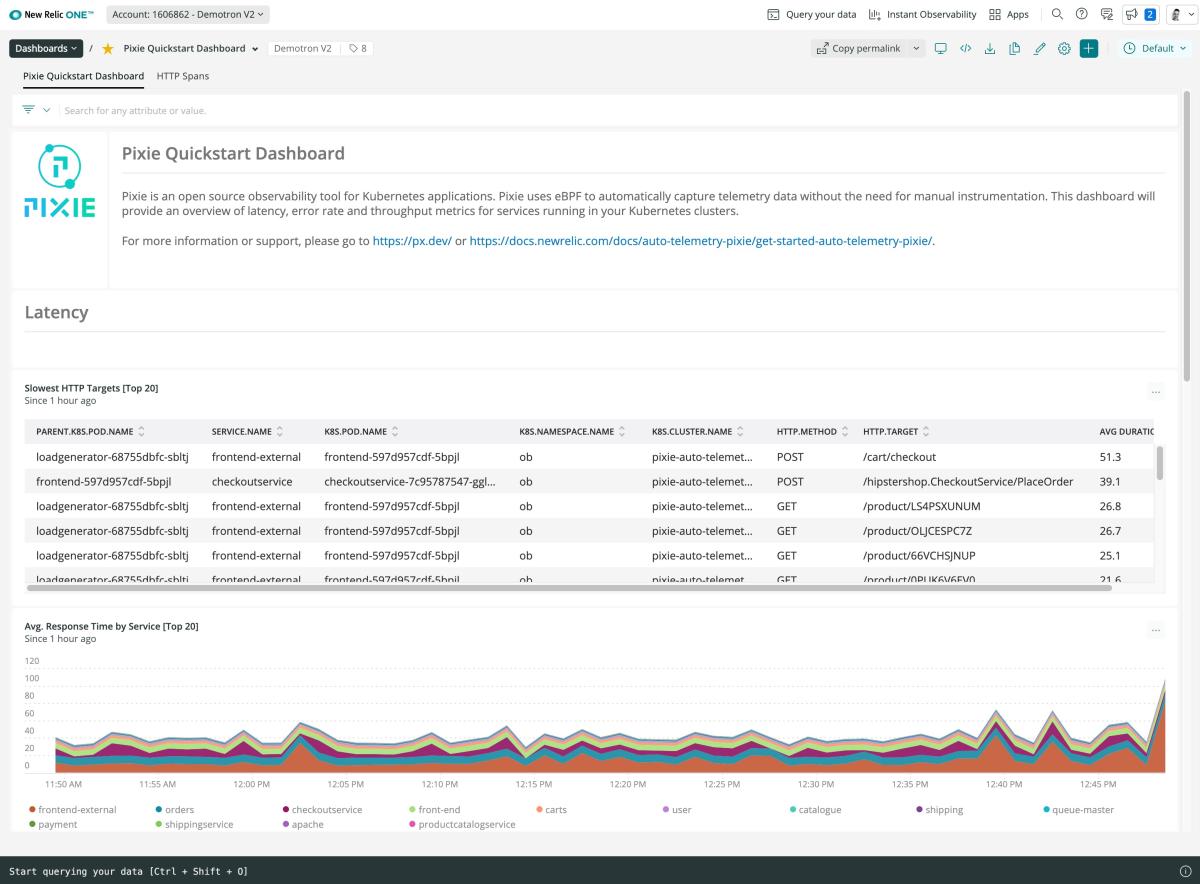
Pixie quickstart contains 1 dashboard. These interactive visualizations let you easily explore your data, understand context, and resolve problems faster.
Pixie Quickstart Dashboard
alerts
3
Pixie observability quickstart contains 3 alerts. These alerts detect changes in key performance metrics. Integrate these alerts with your favorite tools (like Slack, PagerDuty, etc.) and New Relic will let you know when something needs your attention.
Service Errors (%)
This static alert condition evaluates error percentage for Pixie instrumented services
Service Response Time (ms)
This baseline alert condition evaluates response time for Pixie instrumented services
Service Throughput (req/min)
This baseline alert condition evaluates throughput for Pixie instrumented services
documentation
0
This quickstart doesn't include any documentation. Do you think it should?
You can edit this quickstart to add helpful components. View the repository and open a pull request.
View repo
View repo
The Pixie quickstart includes a dashboard providing Latency, Errors, and Throughput visibility for your Pixie services running in Kubernetes as well as example alert conditions.