Image
Quickstart
MongoDB Monitoring
MongoDB enables the unlimited virtual scaling of applications. Utilities like mongostat and mongotop offer immediate results but fail to provide insights into trends in a highly graphical visual dashboard. MongoDB dashboards provide insights into key metrics like connections saturation, oplog size, query and document operations, databases and indexes size, collections and transactions latency, replica set and members status.
Avoid slow queries with proper indexes that impact performance. Instantly monitor your entire MongoDB database with our instant observability kit or the MongoDB free monitoring tool.
The critical differences between MongoDB free monitoring and monitoring MongoDB with New Relic’s instant observability quickstart are efficiency, usability, scope, and cost. MongoDB free monitoring focuses on standalone instances and replica sets. Data collected on disk utilization, memory, and operation execution times are uploaded periodically.
What’s Included?
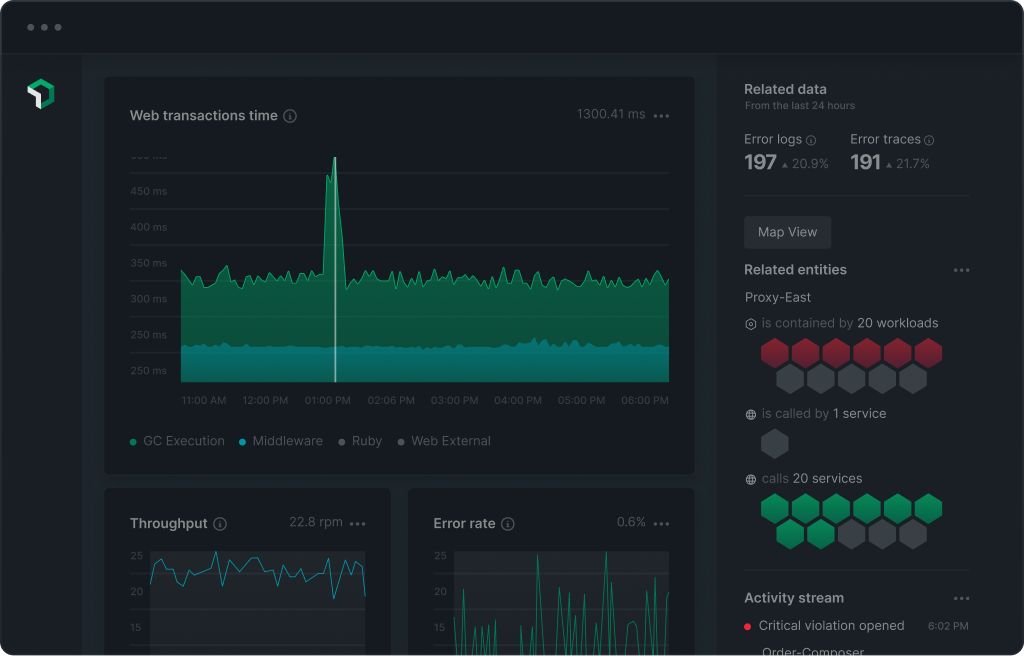
New Relic + MongoDB quickstart - New Relic’s instant observability quickstart provides multiple metrics related to instances, replica sets, members, databases, and collections.
New Relic’s MongoDB quickstart contains a dashboard with meaningful insights, including:
- Predefined dashboard filters by Instance, databases, collections, replica sets, and members.
- Connections saturation, operations by type, databases objects and size, indexes size, commands latency and duration, replica set and member status, and more.
Monitor MongoDB with New Relic to quickly gain improved distribution and increased visibility into real-time user and app response times, throughput and breakdown by component and layer, and long-term data trends over time.
Value of MongoDB Quickstarts
MongoDB performance monitoring with New Relic offers advanced features, including:
- Obtain app performance insights.
- Create custom queries and charts of your data integrations.
- Filter and analyze configuration data and metrics in Infrastructure UI.
New Relic’s instant observability quickstart helps developers reduce administrative overheads and accelerate time to value. As New Relic is SaaS-based, you also don’t have to worry about maintenance or onboarding.
Authors
Support
BUILT BY NEW RELIC
Need help? Visit our Support Center or check out our community forum, the Explorers Hub.
Need help? Visit our Support Center or check out our community forum, the Explorers Hub.