Image
Quickstart
Comprehensive monitoring for your lighttpd server
Lighttpd is an open-source web server designed for high-performance situations while staying standards-compliant, secure, and adaptable.
Why monitor your lighttpd web server?
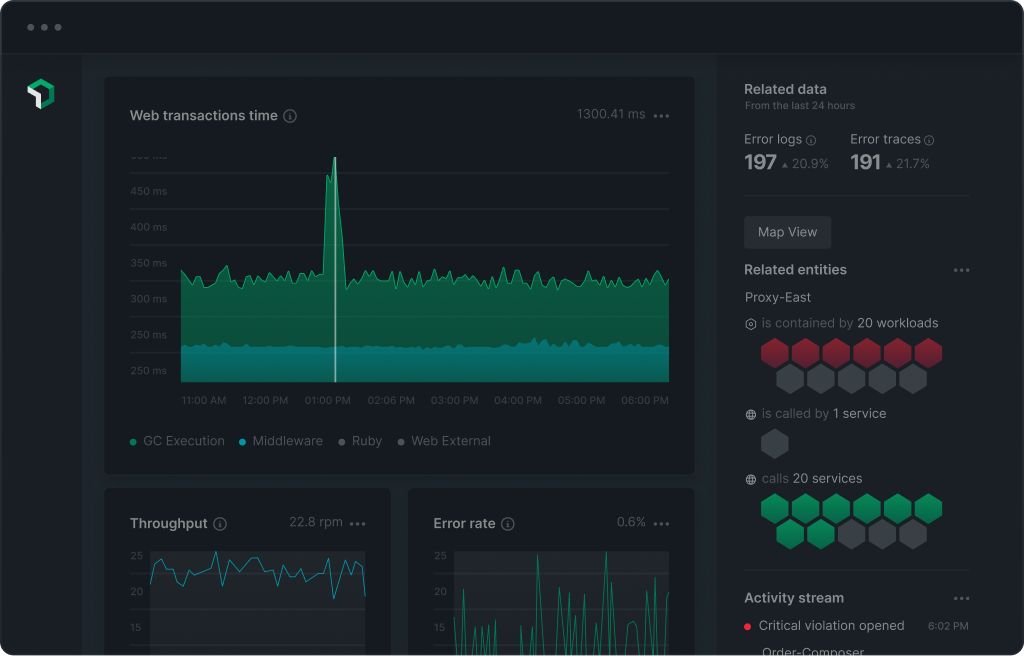
Lighttpd monitoring provides important information to help you construct a complete picture of your web server's performance. This performance data includes uptime, network in bytes and packets, number of requests, and more.
What’s included?
Use New Relic to monitor your lighttpd server for immediate full-stack visibility, including:
- Alerts on things like busy servers, average number of requests and high memory usage.
- Dashboards to monitor crucial performance metrics such as uptime, busy servers, idle servers, networks, requests per second, and more.
Authors
Support
BUILT BY NEW RELIC
Need help? Visit our Support Center or check out our community forum, the Explorers Hub.
Need help? Visit our Support Center or check out our community forum, the Explorers Hub.