New Relic’s announcement of distributed tracing functionality was a major step forward in providing modern software teams the best tools for finding and fixing performance issues, for measuring system health, and for setting team goals and priorities.
 Today, we’re once again enhancing distributed tracing, with a new global search experience for New Relic customers.
Since the launch of distributed tracing, we have continually improved and extended the New Relic platform's capabilities in this area by adding features such as anomaly detection, condensed trace views, deployment markers, and trace groupings. Now, with global trace search, which we're introducing as part of New Relic One, our customers have a powerful set of tools for cutting through confusion and complexity, and for working faster and more efficiently to solve performance issues in distributed software environments.
Global trace search gives our customers a simple yet potent tool for finding traces by using the custom attributes (or tags, in OpenTracing) that teams often add to spans within a particular service. These attributes—for example, user IDs, user email addresses, version numbers, error messages, or tags that describe the type of work being performed in a span—are potentially valuable to other teams that own other services. Until now, however, due to the limited scope of distributed tracing search tools, it has been difficult or even impossible to tap into this value.
(A "span," in this context, represents a discrete, named, and timed operation that defines an individual unit of work done in a distributed system. You can think of a trace as a series of spans with each span describing a specific operation. Teams annotate spans with custom attributes so that they have more and better ways to query, filter, and analyze trace data.)
Trace search made easier—and more powerful
Global trace search eliminates the limitations of existing trace search tools, making it easier for teams to find traces matching specific span attributes, no matter where in the trace those attributes were added. To understand why this is potentially a game-changing innovation, let's look at a simple example involving an application with three services, as shown here:

Imagine that you're the owner of Service C. You can search for traces with errors within your service easily enough, but what you can't do is search for traces within Service C using the customerID attribute, which the owner of Service A added as a custom attribute to a span within their own service. That's because existing search tools force you to scope down your search to just one service, making it impossible to search for traces with the customerID attribute (or any other custom attribute being used in any other service) if you’re not scoped to that specific service.
These limits aren't unique to New Relic's distributed tracing feature. In fact, the trace search functionality within any existing distributed tracing solution is likely to impose similar limitations.
The trouble today with custom attributes
There is a theoretical way to circumvent this problem and make custom attributes created in one service visible and searchable from other services. As the owner of Service C, you could visit your Service A counterpart and ask them to propagate their customerID attribute manually to Service B. Then you can track down the owner of Service B, and ask them to instrument and propagate the customerID attribute onward, this time to your service.
Finally, you'll have access to that customerID attribute—but only after leaning on two of your colleagues to devote time and toil to instrumenting and propagating it for you.
This process is potentially workable when there are just a few services involved. But it becomes practically impossible when working with scores or even hundreds of different services. There’s no way to even know that another service owner had created that customerID attribute, or that other services had also created attributes that you might find useful. If you were in charge of all these teams and services, of course, you could possibly require every service to instrument and propagate every attribute as a matter of policy, but that doesn’t scale over time.
In practice, the cost of all this coordination and manual instrumentation would be prohibitive. And this approach would be well-nigh impossible even to attempt for large distributed applications.
Global trace search: unlocking the power of custom attributes
New Relic's new global trace search offers a better way to address this problem. As shown below, we have expanded the scope of search within distributed tracing, letting New Relic customers search on any span attribute without resorting to manual propagation and without needing to know where attributes originated or with which services they are associated.
For example, as the owner of Service C, you can now search for and find all traces in the system based on the customerID attribute, without having to track down the source of the attribute, and without anyone having to write a single line of code to instrument and propagate it. The same capability applies to searches focused on version numbers, error messages, user/customer information, or any other custom attribute, no matter where in the trace those attributes were added.

Advanced features within New Relic global trace search allow users to define compound span conditions to find traces that contain spans with specific attributes and values, from a specific service. For example, an advanced search can find traces involving both Service A and Service B, where the total duration of Service B was greater than 500 ms and where a datastore query in Service B took longer than 300 ms.
Working with global trace search
Let's take a quick hands-on tour of the global trace search feature to demonstrate how much it improves your ability to find traces quickly, easily, and with greater precision.
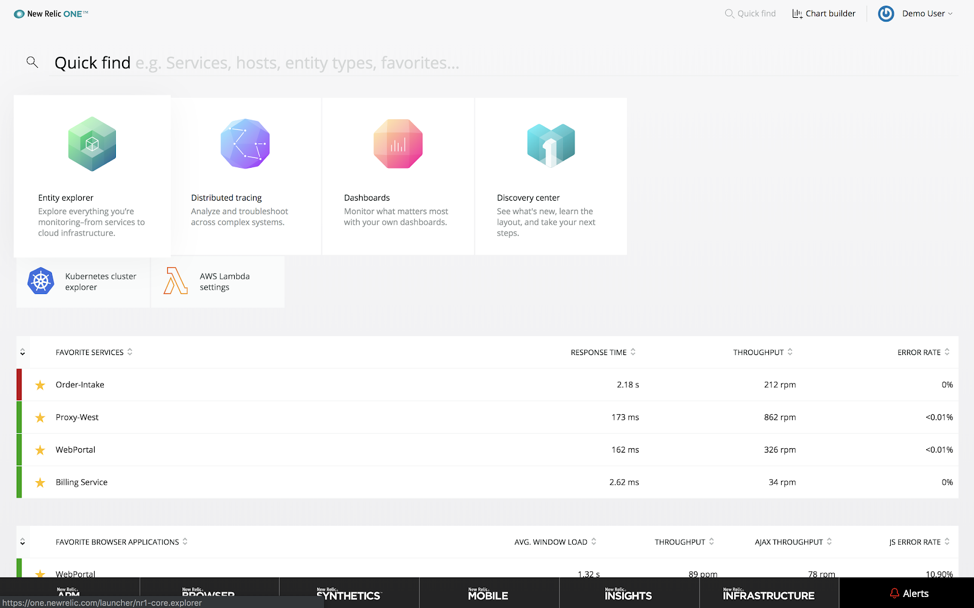
To begin using global trace search, access it via the distributed tracing home page (as shown in the screenshot below) or through the distributed tracing menu item on the New Relic One home page (shown above).
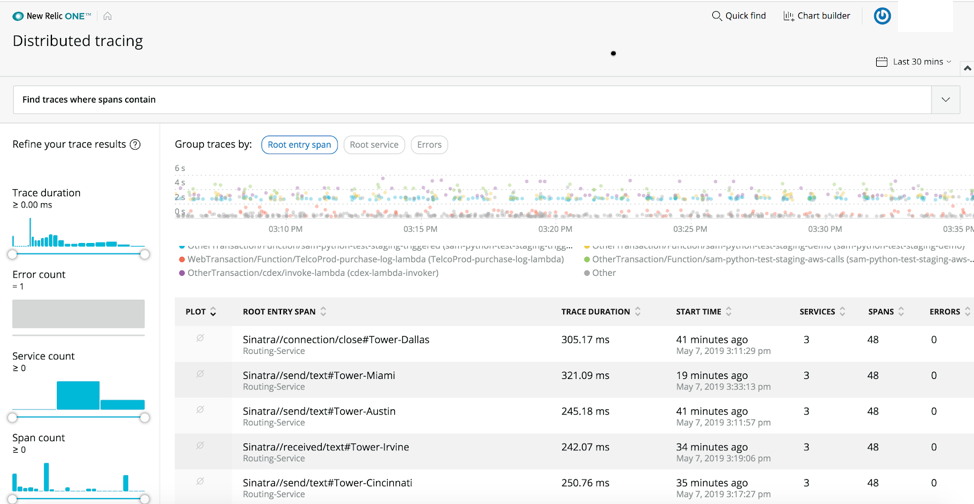
Click the query input for a list of common attributes to query. You can click or scroll down to a suggested attribute or simply start typing the attribute name you have in mind. The search input uses an autocomplete that suggests options based on what you have typed.
After entering the attribute name, choose an operator (equals (=), greater than (>), and so on)) and a value, or select an autocomplete option.
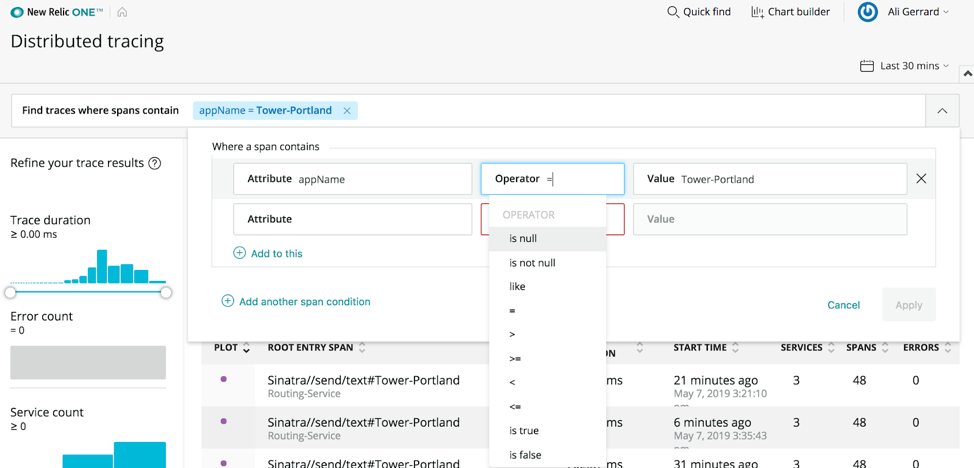
Global trace search also supports compound conditions that match a query for spans against multiple attributes and values. Click on the arrow on the right side of the input bar to expand the form and enter multiple conditions. All of the conditions in a group must be met within the same span for matching traces to appear in the search results.
When used in this manner, grouped conditions allow you to find traces where the span comes from a specific service, with a specific name and duration. That’s a powerful capability, especially in very large and complex distributed environments.
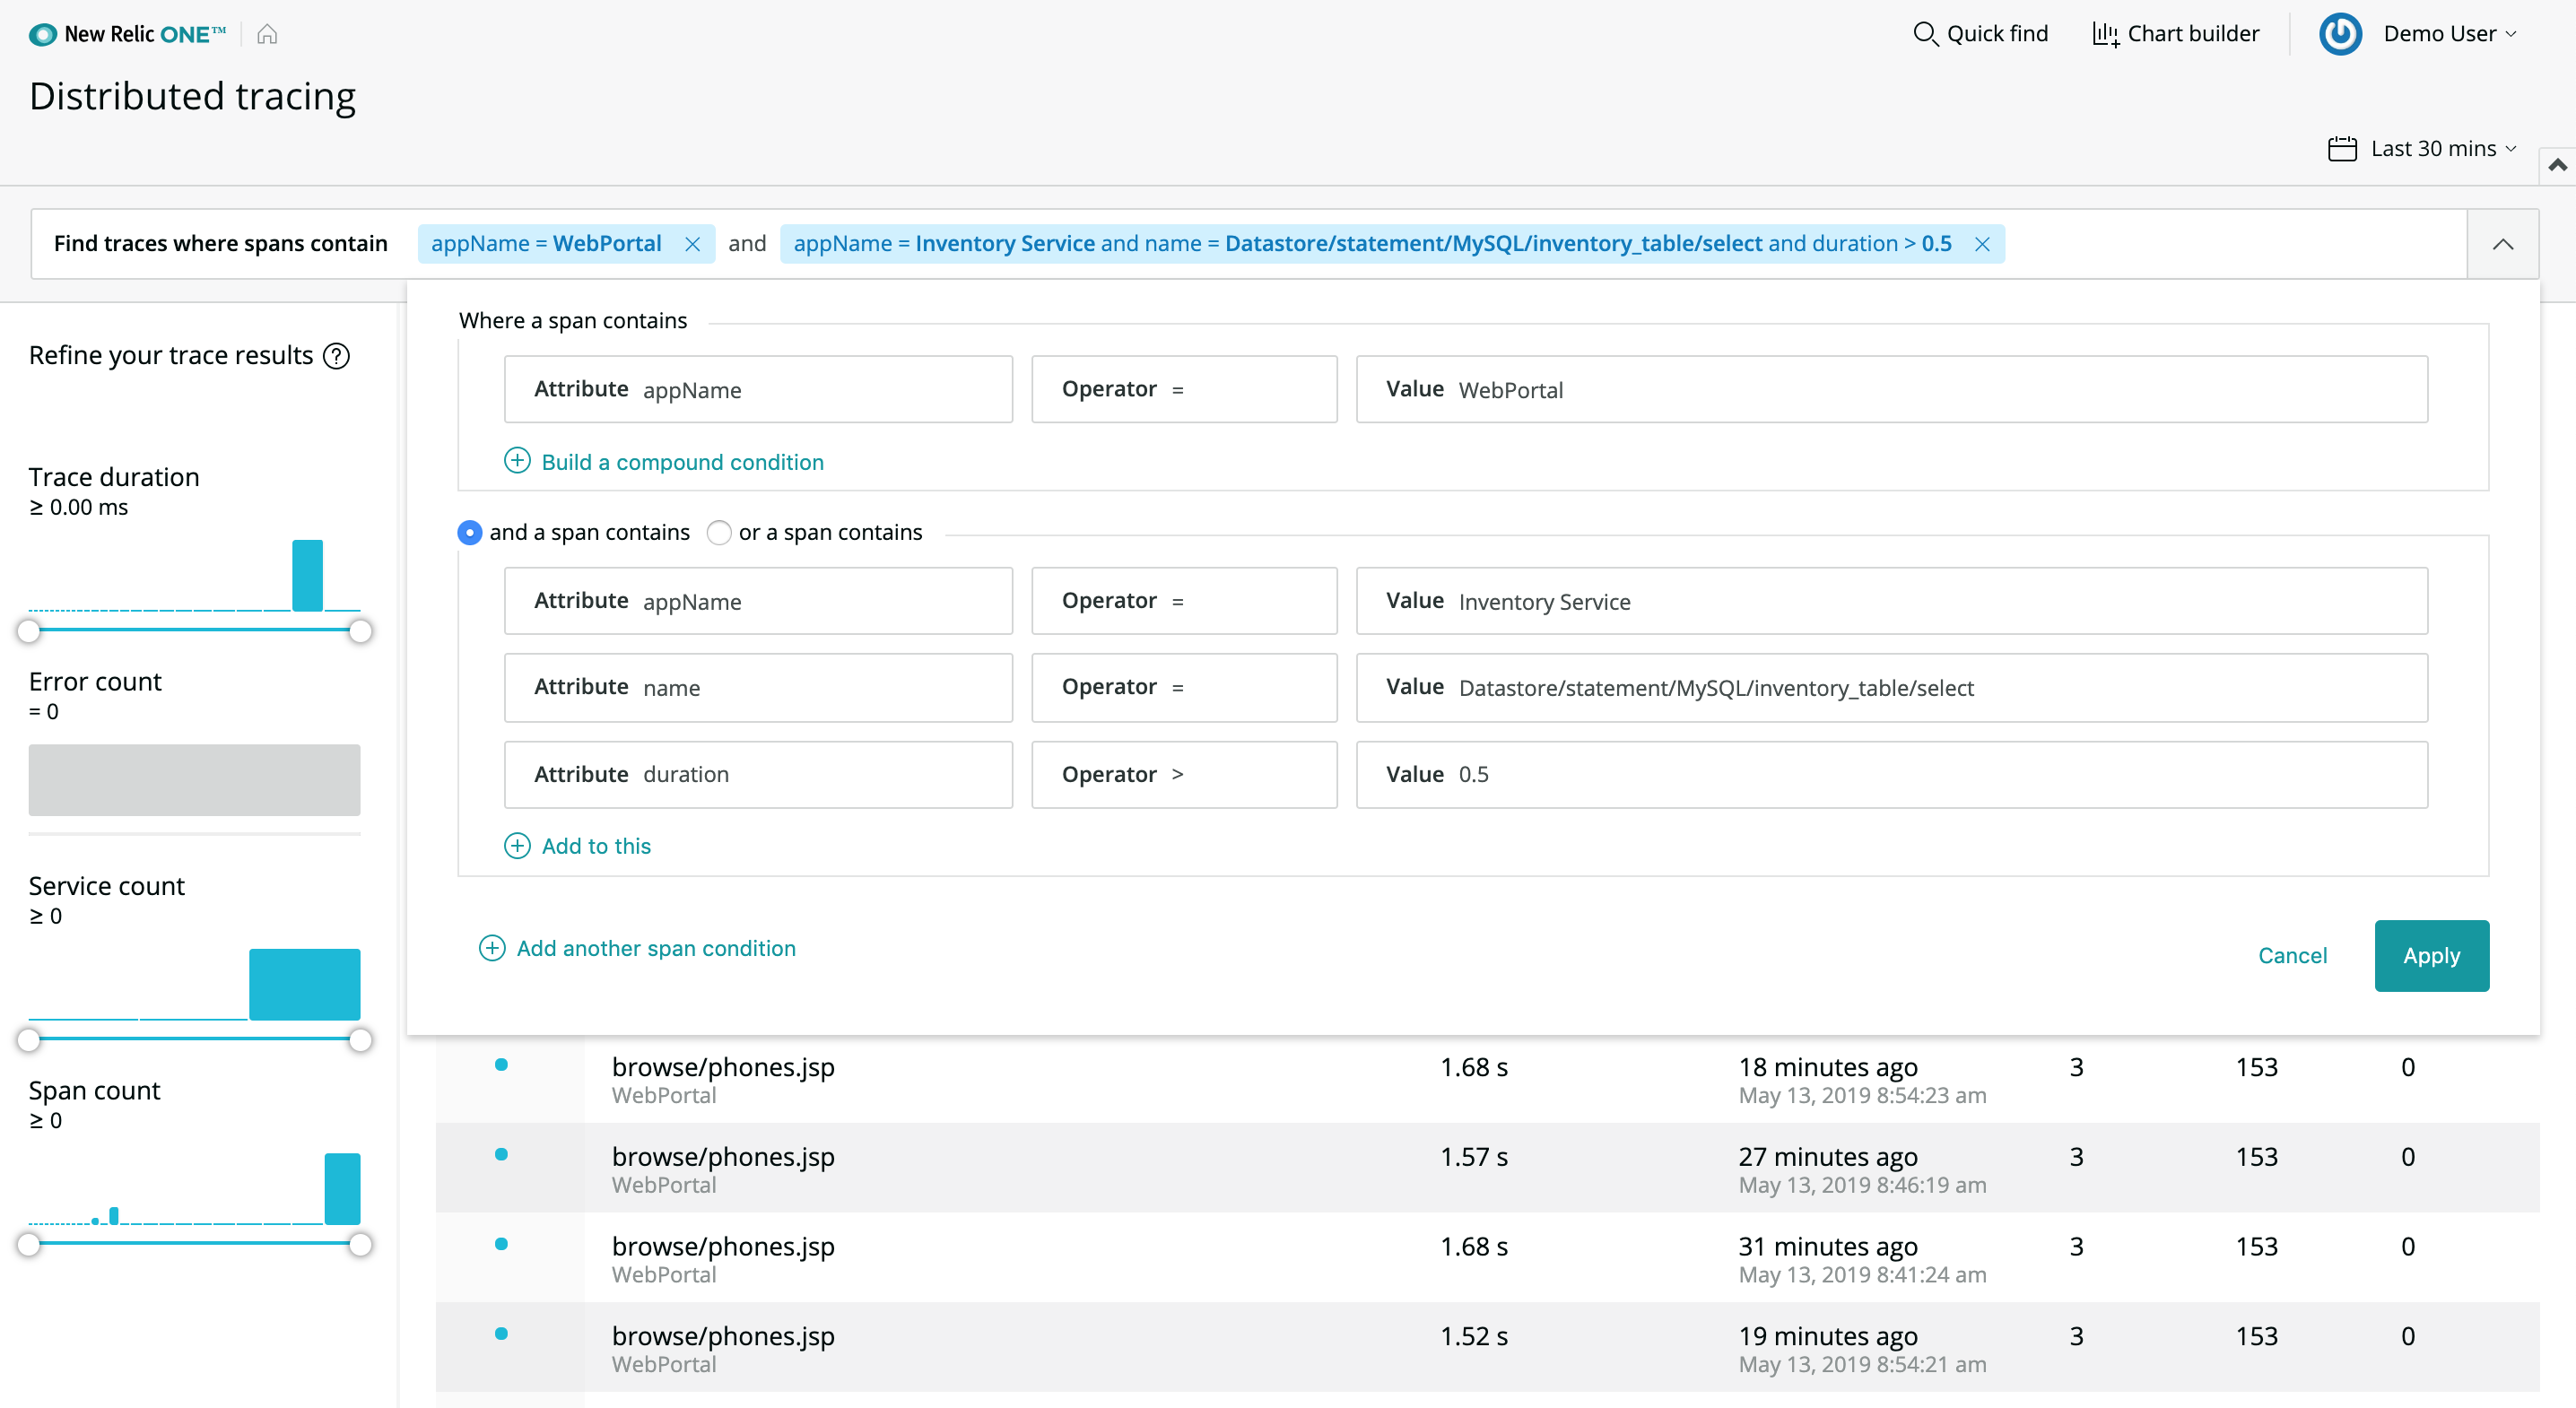
Distributed tracing was designed to work across New Relic accounts; trace queries run across all accounts that a user has permission to access, and global trace search results follow the same access rules. Keep in mind that if an account doesn't have permission to access a service, then you cannot query for attributes and values in spans generated by that service.
Availability and pricing
Global trace search is available today to all customers on New Relic Pro or equivalent subscription plans.
We’re excited to connect our customers with this powerful new way to find traces! Global trace search gives teams access to the full set of attributes that have long been present in distributed tracing but were nearly impossible to use effectively. Today, all of this is changing. As a result, we think distributed tracing in New Relic One will become even more valuable to our customers and to their businesses.
Learn more about New Relic One at newrelic.com/platform.
Additional New Relic One resources
- New Relic One
- New Relic One press release
- New Relic One data sheet
- Introducing New Relic One: Our Platform for the Next Decade
- New Relic One: Deliver More Perfect Software Faster
- New Relic One: Why Be Entity-Centric?
- Dashboards in New Relic One: A Faster Path to Action
- New Relic documentation: Introduction to New Relic One
- Introducing New Relic Monitoring for AWS Lambda
The views expressed on this blog are those of the author and do not necessarily reflect the views of New Relic. Any solutions offered by the author are environment-specific and not part of the commercial solutions or support offered by New Relic. Please join us exclusively at the Explorers Hub (discuss.newrelic.com) for questions and support related to this blog post. This blog may contain links to content on third-party sites. By providing such links, New Relic does not adopt, guarantee, approve or endorse the information, views or products available on such sites.


