New Relic mobile monitoring provides complete visibility into the performance and troubleshooting of Android, iOS, and hybrid mobile applications. In today's intensely competitive market, mobile application developers have to ensure consistent availability and excellent user experiences. With businesses becoming more reliant on mobile applications to drive engagement and revenue, the requirement for efficient monitoring solutions has become critical.
Overview of the solution
Performance metrics are tracked by mobile app monitoring, which identifies shortcomings imposed on by servers, networks, devices, code, and other factors. Analysis helps prevent and resolve issues that are vital to a seamless user experience. Time-series data measures of crashes provide insights, and end-user reports enhance analysis, although they can be challenging to connect to specific issues.
Essential metrics to gauge your app's performance and health
Though web users have adapted to minimal delays, mobile users want quick response times from their apps. User experience can be adversely affected by performance problems. The broad range of devices that have various specifications and the fluctuation of mobile networks increase these challenges.
Understanding exactly when and where consumers experience issues like crashes, delayed UI loading, and Application Not Responding (ANR) errors, it’s essential to quickly identify and resolve these problems. Tracking these metrics over time gives you insights into how well your app is performing and ensures that your team is informed as soon as service level goals are not met.
Below are essential metrics for evaluating your app's performance and health.
Application start time/app launches
The performance of your application must be efficient; slow starts won't go unnoticed by users. Launch speed is an excellent indication of the quality of your software, and tracking it helps you determine how responsive it is. Use New Relic to track important data—such as cold time, hot launch time, and more—to improve the performance of your app.
Android vitals deem the subsequent app startup times to be excessive:
- It takes at least 5 seconds to start up cold
- Hot startup requires at least 1.5 seconds or longer
Cold start: A cold start refers to an app’s start from scratch.
Hot start: A hot start refers to when your app’s process is already running in the background.
Service map
The service map breaks down your application into all of its component services and depicts the observable dependencies between these services in real time, allowing you to discover bottlenecks and understand how the data flows across your architecture from frontend to backend. This will list your user experience, services, infrastructure, and network entities, including engineering operations.
Geographic distribution
By looking at the geographic distribution report, you can identify the countries, business regions, or geographical regions where an application gets most of its visitors/unique visitors. Geo distribution includes: network requests, data transfer size, failure rates etc.
Distributed transactions
It might be difficult to diagnose performance problems, particularly if they occur intermittently. Looking at the application logs, we can see that the app takes more than 1 second to fetch data from the database or from third-party APIs. Beyond this observation, no immediate insights are provided by the logs.
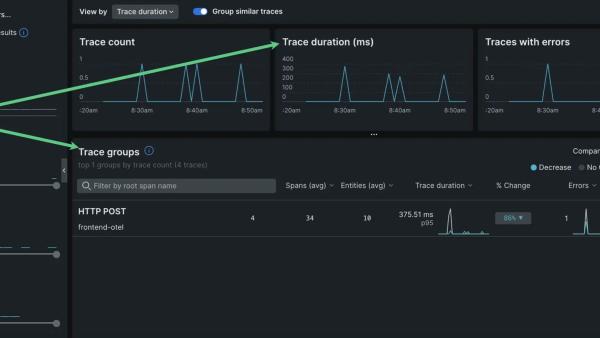
Distributed tracing can greatly enhance monitoring across complex application landscapes, encompassing multiple services or applications. This isn't just for web apps. We extended it to iOS and Android mobile applications, revealing new performance insights.
Crashes
Large-scale mobile apps are bound to crash. New Relic instrumentation helps in identifying high-impact crashes. To find functions or methods that are causing problems, display crash data particular to each session and user journeys.
Change tracking
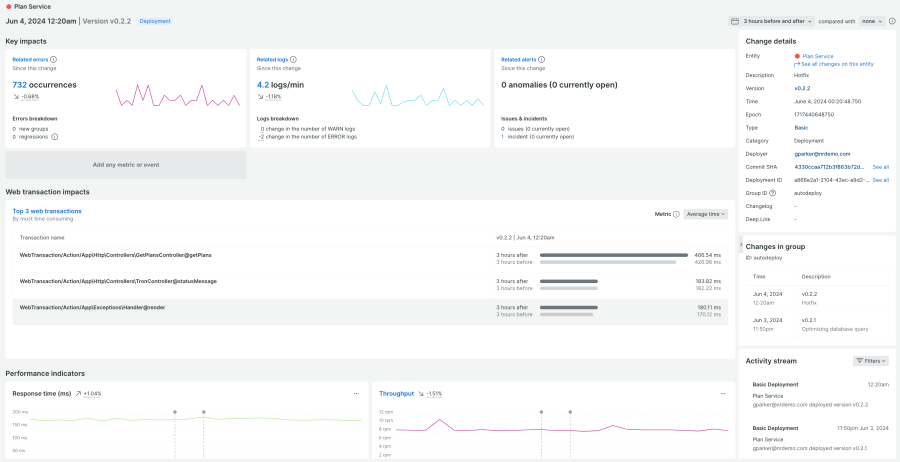
Hotfixes and new, significant code changes are captured using change tracking. Using an automated deployment pipeline integration or an API, you can record changes and see them as markers on the mobile summary page.

Errors inbox
A centralized method for recognizing and assigning priority to problems. Similar instances of errors or events are grouped together in an errors inbox. When two errors have the same fingerprint, they’re combined into one error group. Rich error information is provided, enabling you to rectify errors more quickly and in the context of the entire stack.
Comparison of different app versions
For insight into the success of your release, leverage our release versions page to compare crash rates, user engagement, and performance indicators across different releases.
User journeys
You can now quickly access an extensive overview of every user interaction preceding a crash with New Relic user journeys. This enables you to keep track of every stage of the mobile user journey and identify and address issues more quickly, preventing any interruptions before they negatively impact the user experience.
Offline telemetry data
A data payload is retained locally if it cannot be sent online. The data is transferred to New Relic and removed from storage as soon as a connection is established again.
Conclusion
Strong observability for mobile applications helps ensure an enjoyable experience for users. You can improve application durability and customer satisfaction by tracking crashes, monitoring performance, and quickly solving issues using tools like New Relic mobile monitoring.
Next steps
If you’re an existing New Relic customer, see the following links:
- Monitoring your React Native application
- Learn how to configure your mobile monitoring settings and to use pre-built mobile analytics dashboards
- Flutter mobile application monitoring to boost UX
- New and improved mobile SDK API documentation
Don’t have New Relic yet? Sign up for a free account. Your account includes 100 GB/month of free data ingest, one free full-access user, and unlimited free basic users.
The views expressed on this blog are those of the author and do not necessarily reflect the views of New Relic. Any solutions offered by the author are environment-specific and not part of the commercial solutions or support offered by New Relic. Please join us exclusively at the Explorers Hub (discuss.newrelic.com) for questions and support related to this blog post. This blog may contain links to content on third-party sites. By providing such links, New Relic does not adopt, guarantee, approve or endorse the information, views or products available on such sites.


