It’s Sunday morning. You’re finally getting to relax. You just got your favorite coffee. And your pager goes off … Not good. Immediately, you want to know: What’s changed? Is my application or service the trigger? And when can I get back to my coffee? And probably not in that order.
Here on the New Relic Applied Intelligence Team, we’re obsessed with building tools that help get you back to that coffee—fast. That’s why last year, when talking about tools we wanted for our own on-call rotations, we struck on the need for a tool that can handle an essential task: Show me what’s super weird related to the application or host that’s paging me.
Nine months ago, we released incident context for New Relic Alerts to do just that: automatically highlight anomalous behavior in key signals related to the application or host that’s paging you. We designed the feature to get you this information as fast as possible; and we have also added it to PagerDuty, Slack, email, and New Relic’s own mobile app.
We’ve been iterating on our incident context capabilities ever since that initial release, in July 2018. Now is a good time to highlight some of the most important of these upgrades, and to explain how they benefit our customers and their organizations.
New and powerful anomaly detection capabilities—for every New Relic APM alert
At release, incident context detected anomalies only on latency. So we focused our first step post-release on adding more signal coverage for New Relic APM 360. We now automatically detect anomalies in throughput, latency, errors, and transactions that lead up to an alert for an application.
With this new coverage, we now address three out of the four “golden signals.” This gives you powerful heuristics to help understand which changes in an application could have contributed to the condition that triggered an alert.
Here's an example: Imagine that you're on call for an application, and you receive an alert concerning a response-time threshold violation. Before you can even read the page, incident context has automatically examined throughput, latency errors, and transaction signals related to the application in the six hours before the alert. In this scenario, incident context detects latency in the datastore that the application relies on, and it reveals a direct connection between the database issue and the slowdown in the application. It also highlights this information in the alerts overview page, as well as via Slack, PagerDuty, email, and New Relic’s mobile app.
This insight gives you a powerful advantage: In the first screen you see while responding to an alert, incident context has already helped you identify a strong correlation between completely separate problems. And you reap the benefits, which are based entirely upon our automated anomaly detection capabilities, with zero setup required on your part.
For a quick overview on what incident context is and how to use it, watch the short video below, then read on for more detail:
Automatic anomaly detection for correlated apps—for every New Relic Infrastructure alert
After adding strong coverage of key signals for APM applications, we focused next on New Relic Infrastructure alerts. Through conversations with our customers, we learned that many look at their New Relic Infrastructure alerts and then try to correlate the impact of the problem on downstream applications. By leveraging the New Relic platform’s relationships service, we were able to correlate APM and Infrastructure data, and to link apps to the hosts on which they run. Incident context can then trigger anomaly detection on applications running on hosts that are violating their alert condition.
Like everything in the incident context feature, there's no setup or configuration needed to take advantage of these capabilities. This is powerful stuff!
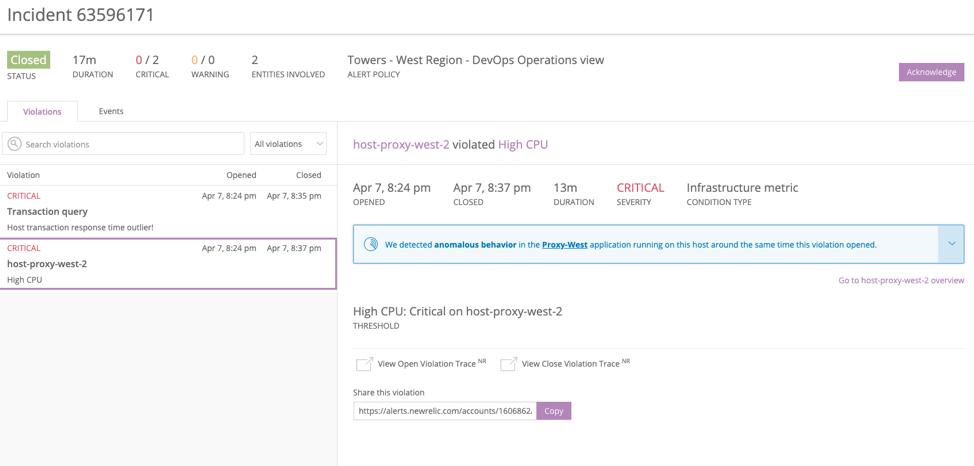
Here’s a sample scenario: You receive an alert that a host has violated its CPU threshold, and incident context automatically examines throughput, latency errors, and transactions signals for the six hours preceding the alert for all applications running on that host. If incident context detects an issue in any of the applications, the feature highlights the issue for you alongside your Infrastructure alert notification. That helps you determine the impact of the issue.
A tighter focus on the “shape of the data”
Our customers also told us that when responding to incidents, the “shape” of the data is often more important than the actual numbers. Why? Responders want to know where to start investigating—and a spike in a chart makes it easy to choose where to begin troubleshooting. So, incident context now uses sparklines, which summarize a breakdown chart, to communicate anomalies visually—making the shape of the data easier to see and compare.
We also now provide more information in the text description of incident content. So, for services where there is only one anomaly, we bring in the service name itself rather than the anomaly category. We call this "hoisting," and here’s how it works.
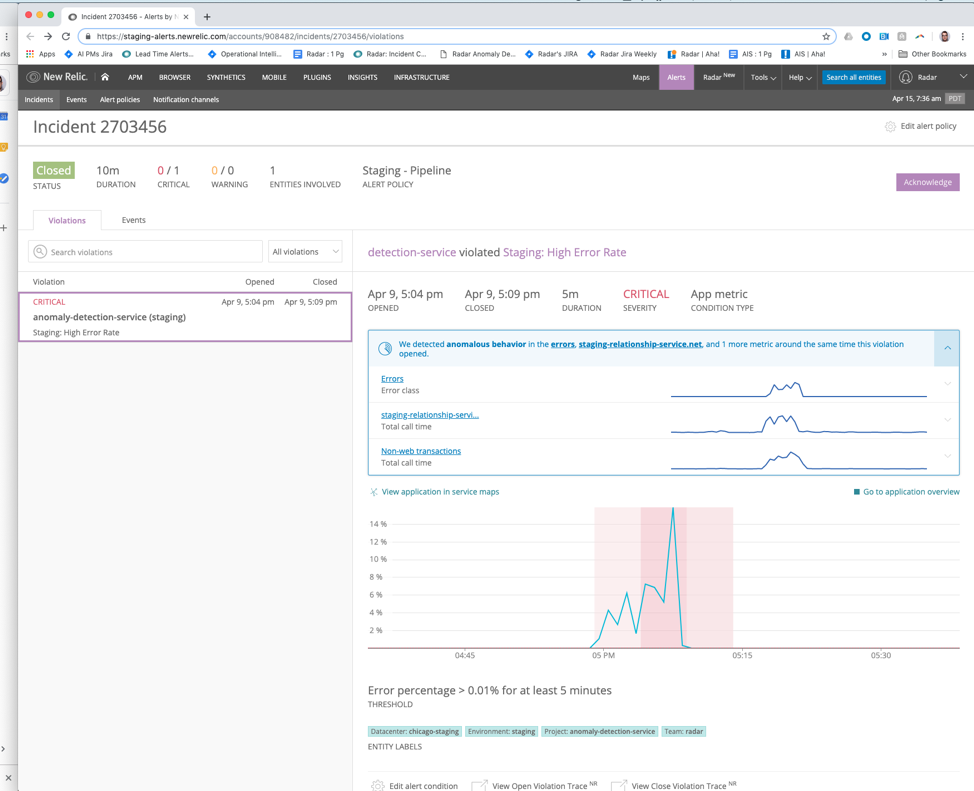
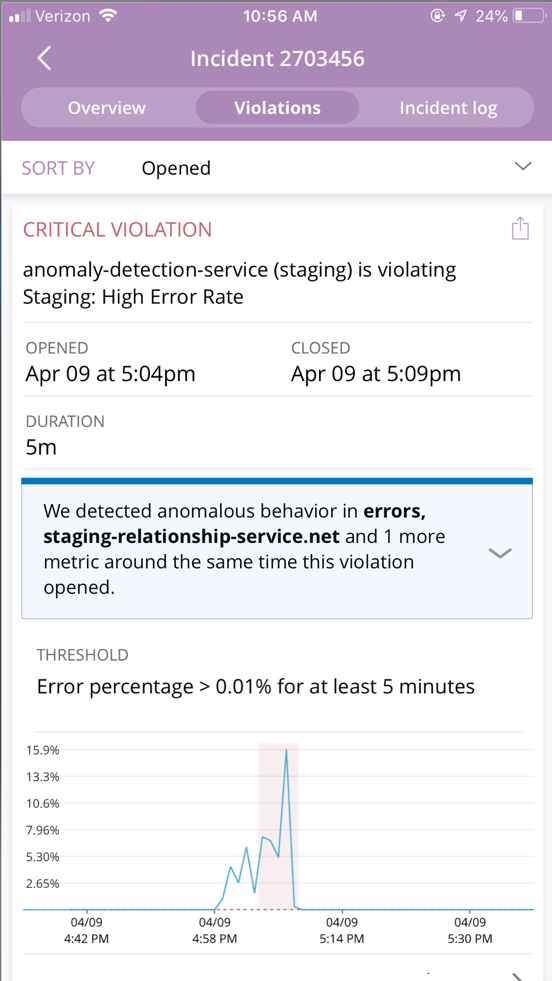
In the example below, incident context has detected anomalies in error class, as well as in the total call time of the external service the broken application relies on, along with an anomaly within non-web transactions. You can easily compare the shapes of all three signals by looking at the sparklines before clicking into each one.
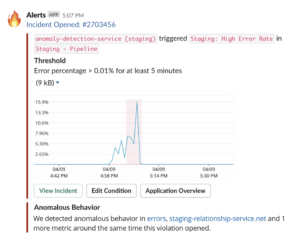
For anomalies where we’ve identified a single source, we hoist the name of that service in the banner text itself. The image below, for example, shows staging-relationship-service.net in the text to help you more quickly understand what’s going on.
Anomaly information now goes where you go—on your terms
During an incident, you want to understand what’s going on as fast as possible. As the pressure rises, switching among multiple tools becomes mentally taxing. That's why a consistent goal for the incident context feature has been meeting our customers on their terms—and going where they already are.
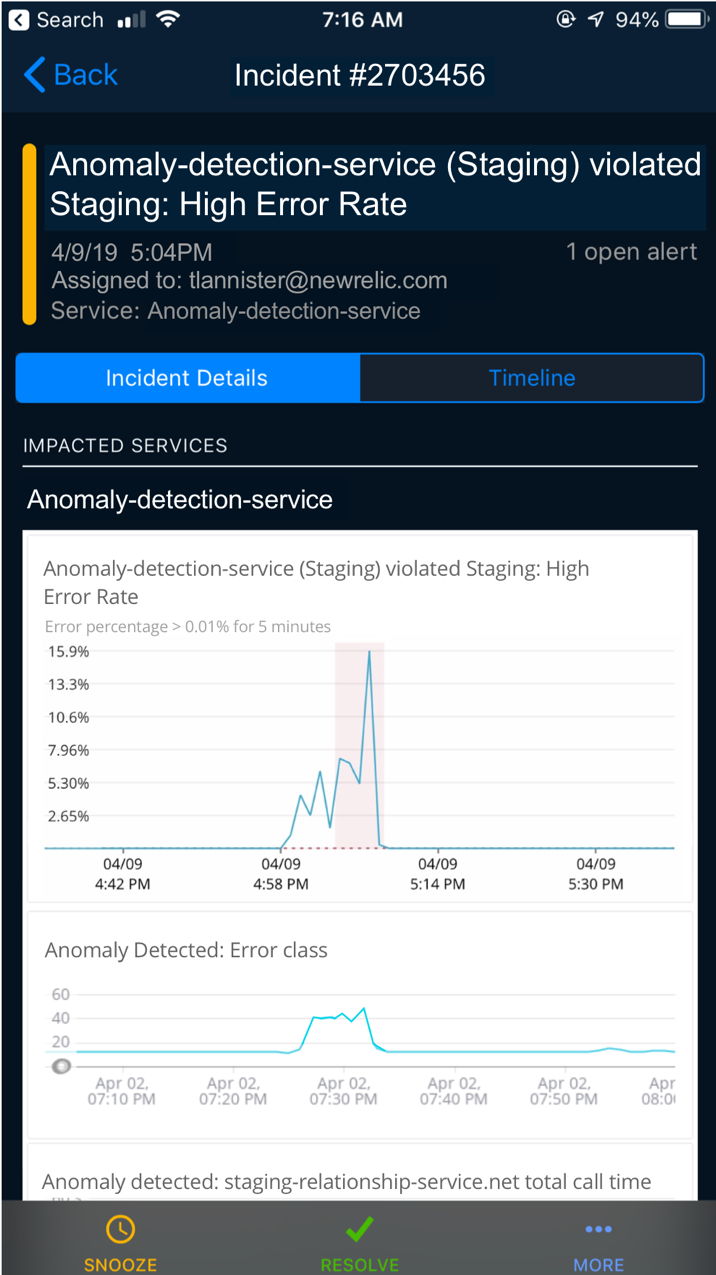
As a result, incident context now communicates anomaly information via PagerDuty, Slack, email, and New Relic’s mobile app—making information accessible as close as possible to the alert and to the first screen. You no longer have to deal with multiple clicks, multiple screens, or jumping between systems to get the answers you need.
A critical part of the benefit for you is access to automatic anomaly detection, including the time series chart of the anomalies, directly in PagerDuty’s mobile app and website. Unlike some other observability and APM platforms that force you to configure exactly what dashboards you want to connect with PagerDuty, NewRelic applied intelligence requires zero configuration or maintenance on your side. This is a big deal, especially in complex microservice environments where systems and services can change without warning, and where preset dashboards may not be able to keep up.
What’s next for New Relic’s incident response tools?
Our team is very excited to bring these incident context improvements and enhancements to our customers. The next time you receive a New Relic alert, look for incident context in your PagerDuty, Slack, and email accounts, in the New Relic mobile app, and in the alerts incident overview page. All of these capabilities are available to all New Relic customers with at least one Pro-level or higher subscription.
And we’re far from done: We’re still working hard to make it faster and easier for you to deal with incidents and alerts. In the meantime, watch for the blue incident context box—and visit the New Relic community (https://discuss.newrelic.com/c/feature-ideas/feature-ideas-alerts) to tell us about the next set of tools and improvements you’d most like to see to help ease the pain of being on call.

The views expressed on this blog are those of the author and do not necessarily reflect the views of New Relic. Any solutions offered by the author are environment-specific and not part of the commercial solutions or support offered by New Relic. Please join us exclusively at the Explorers Hub (discuss.newrelic.com) for questions and support related to this blog post. This blog may contain links to content on third-party sites. By providing such links, New Relic does not adopt, guarantee, approve or endorse the information, views or products available on such sites.


