Andy Wetzel, a Senior Director, Solutions at New Relic, contributed to this post.
More people are streaming video than ever before, but that means expectations are higher than they’ve ever been. If one streaming app doesn't meet a viewer’s expectations, they only need two or three clicks to find one that does. Channel crashes, unavailable streams, errors, and rebuffering not only cause viewer frustration but also churn.
Roku is the most widely used streaming device platform, which means it’s critical that you monitor and understand the performance of your channels on that platform. To help you get the telemetry data you need, we've created an open source agent for Roku. With our agent, you can capture and analyze device and channel metrics, HTTP request details, and video quality of experience (QoE) events so that you can ensure your Roku channels continue to delight your viewers.
More specifically we built our agent with three uses cases in mind:
- Product owners can use data gathered by the agent to ensure Roku channels are performing as expected and driving the desired viewer engagement.
- Streaming architecture and API owners can use the data to collaborate with product owners to optimize backend API and CDN configurations to improve viewer experience. Such teams can view Roku telemetry in context with browser, mobile, service (including serverless), infrastructure, and log data to create comprehensive observability for streaming architectures.
- Roku developers can use the data to better understand the performance of channel code, HTTP calls, and channel navigation, identify and remediate quality and performance problems, and track improvements from build to build.
In this post, we’ll show you how to use the New Relic Roku Agent to monitor both system- and video-level events, so you can be sure you’re delivering exceptional viewer experiences and driving customer satisfaction engagement, and operational efficiency on the Roku platform.
Getting started with New Relic Roku Agent
The video-agent-roku repo on GitHub details the full process for installing and using the agent. To send both system events and video events, you’ll need an Insights Pro subscription. To initialize the agent, you’ll need an account ID and an API key.
In this example, we’ll show you how to set up NewRelicSystemStart to capture HTTP requests and other system events. (See the repo for details on adding NewRelicVideoStart to capture events like video starts and video buffers.)
- Download the Roku video agent and unzip the file.
- Open your Roku app project’s directory and copy the
NewRelicAgentfolder to the components directory and the NewRelicAgent.brs file to thesourcedirectory. - Call
NewRelicfrom the Main subroutine (main.brs) and store the returned object. - Call
nrAppStarted. (This is optional, but we recommend you add it, as you’ll get information about when an app is started, or if there was an error). - Call
NewRelicSystemStartto start capturing events for the system.
Here’s an example configuration:
sub Main(aa as Object)

     screen = CreateObject("roSGScreen")

     m.port = CreateObject("roMessagePort")

     screen.setMessagePort(m.port)


     'Create the main scene that contains a video player

     scene = screen.CreateScene("VideoScene")

     screen.show()


     'Init New Relic Agent (3rd argument is optional, True to show console logs)

     m.nr = NewRelic(“ACCOUNT ID“, “API KEY“)

     'Send APP_STARTED event

     nrAppStarted(m.nr, aa)


     'Pass NewRelicAgent object to the main scene

     scene.setField("nr", m.nr)


     'Activate system tracking

     m.syslog = NewRelicSystemStart(m.port)


     while (true)

          msg = wait(0, m.port)

          if nrProcessMessage(m.nr, msg) = false

               'It is not a system message captured by New Relic Agent

               if type(msg) = "roPosterScreenEvent"

                    if msg.isScreenClosed()

                         exit while

                    end if

               end if

          end if

     end while

end sub
See it in action:
Viewing your Roku data in New Relic
The Roku agent sends actions and attributes to two eventTypes—RokuSystem and RokuVideo. For example, actions for RokuVideo include:
| Action name | Description |
|---|---|
Action namePLAYER_READY |
DescriptionPlayer is ready to start working. It happens when the video agent is started |
Action nameCONTENT_REQUEST |
Description“Play” button pressed or autoplay activated |
Action nameCONTENT_START |
DescriptionVideo started playing |
Action nameCONTENT_END |
DescriptionVideo ended playing |
Action nameCONTENT_PAUSE |
DescriptionVideo paused |
Action nameCONTENT_RESUME |
DescriptionVideo resumed |
Action nameCONTENT_BUFFER_START |
DescriptionVideo started buffering |
Action nameCONTENT_BUFFER_END |
DescriptionVideo ended buffering |
Attributes for RokuVideo include:
[table id=53 /]
There are also action-specific attributes such as:
[table id=54 /]
For a full list of actions and attributes for the RokuSystem and RokuVideo eventTypes, see the Data Model section of the Roku agent repo.
After you get the agent running, go to the account you specified for the installation and run the following query in New Relic Dashboards:
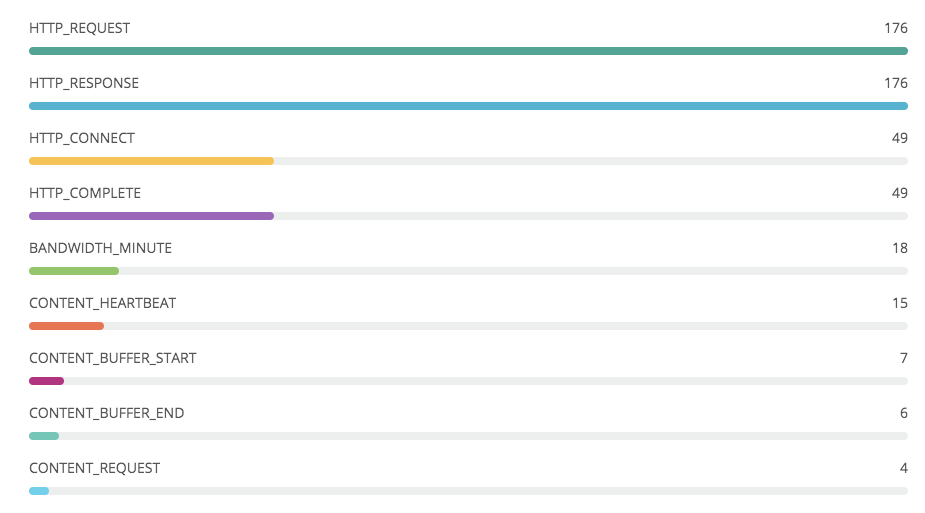
FROM RokuSystem, RokuVideo SELECT count(*) FACET actionName
You should see a chart similar to the following:
Now you can run more queries to answer some simple questions:
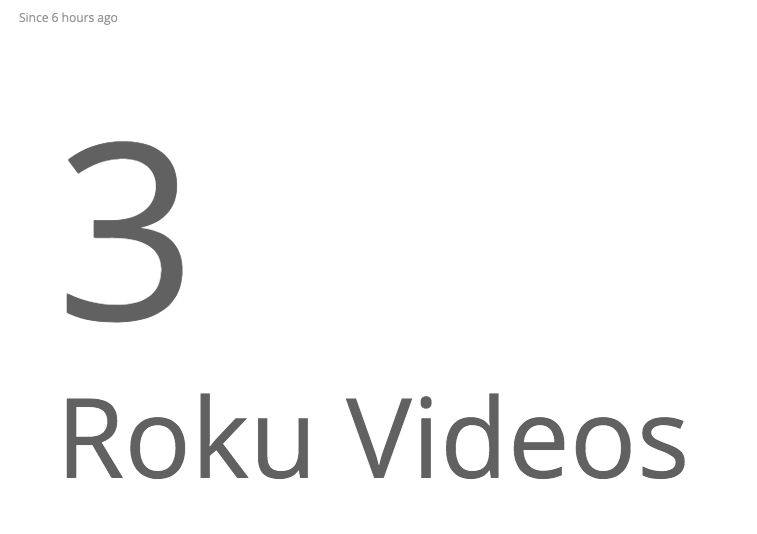
- How many plays occurred in the last 6 hours?
FROM RokuVideo SELECT count(*) WHERE actionName = 'CONTENT_START' since 6 hours ago
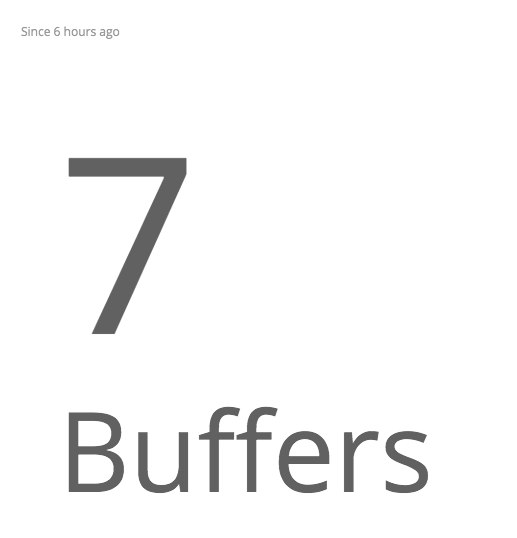
- How many buffering events occurred?
FROM RokuVideo SELECT count(*) WHERE actionName = 'CONTENT_BUFFER_START' since 6 hours ago
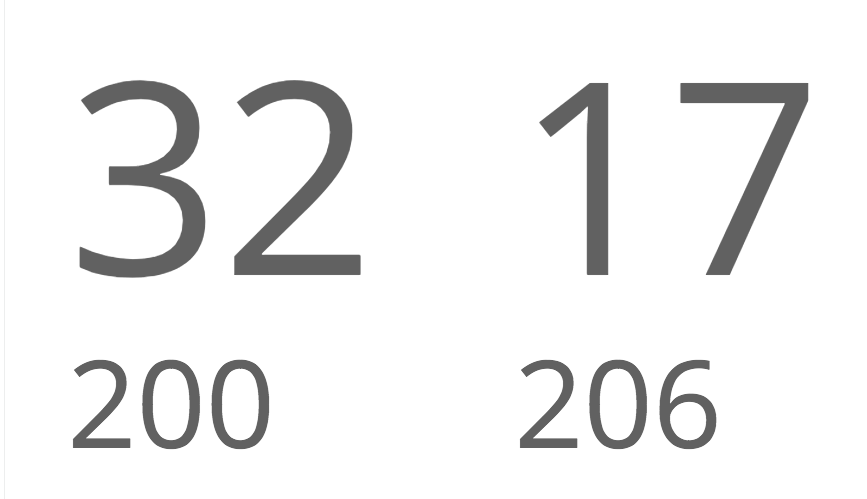
- How many HTTP requests were made and what was the status of the requests?
FROM RokuSystem SELECT count(*) WHERE actionName = 'HTTP_REQUEST' and 'HTTP_RESPONSE' since 6 hours ago
Those aren’t the most exciting analytics, so to get the full power of New Relic One, you’ll want to create a dashboard to track your Roku system and video events. The enablement folder in the agent repo contains a JSON document you can use to import a starter Roku dashboard into New Relic One.
- From the repo, copy the contents of
roku-dashboard.json. - Replace
<account_id>with the New Relic ID where you have your Roku data. - Navigate to http://one.newrelic.com.
- Click the Dashboards launcher.
- Click Import a dashboard.
- Paste the JSON file, and click Import dashboard.
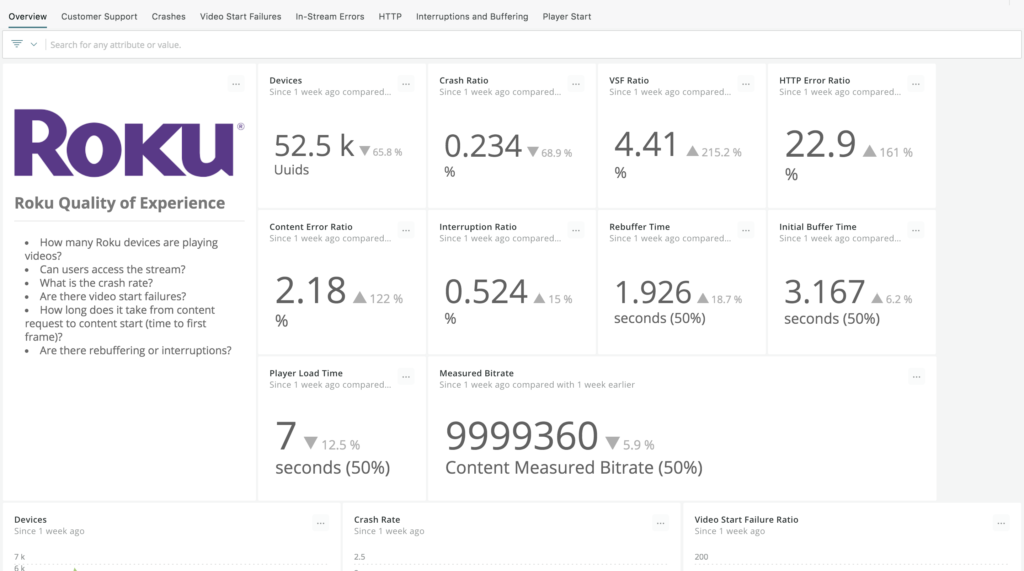
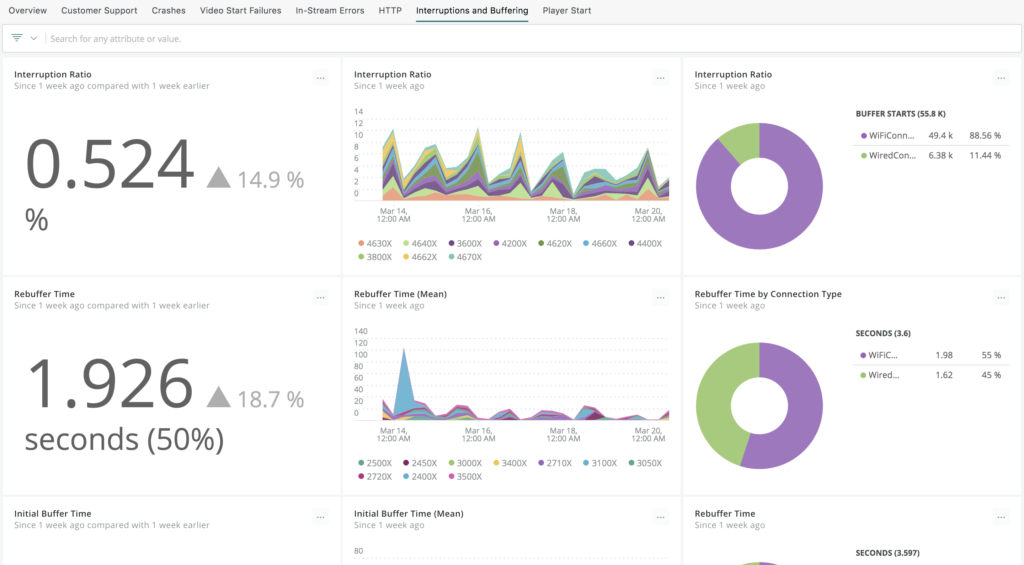
Here’s what it looks like:
See it in action:
Finally, the Roku agent includes an API you can use to add custom attributes or instrument the keypresses from the Roku remote to understand how users navigate through your channel. To learn more, check out the Agent API section of the ReadMe.
The New Relic Roku Agent: part of a balanced (telemetry) diet
Measuring and improving Roku QoE is one part of creating observability for your streaming architecture. You’ll also want to compare Roku QoE to web, mobile, and other devices; diagnose issues with HTTP endpoints; and ensure that your cloud-based scaling is working as expected, especially on your biggest days. You can do all of that and more with New Relic One.
Sign up now for a New Relic account, or request a demo.
Finally, submit questions to the Roku discussion topic on the Explorers Hub, or submit issues on the repo. This project is open source, and welcomes contributions. To submit a pull request, see the Contributing section of the repo for guidance.
The views expressed on this blog are those of the author and do not necessarily reflect the views of New Relic. Any solutions offered by the author are environment-specific and not part of the commercial solutions or support offered by New Relic. Please join us exclusively at the Explorers Hub (discuss.newrelic.com) for questions and support related to this blog post. This blog may contain links to content on third-party sites. By providing such links, New Relic does not adopt, guarantee, approve or endorse the information, views or products available on such sites.

