For Python developers building asynchronous applications using async/await syntax, asyncio is an essential library in many frameworks. While the New Relic Python agent has always worked well for synchronous frameworks like Django and Flask, developers on popular asynchronous frameworks like Tornado, aiohttp, and Sanic have had less than ideal visibility into their applications.
Version 5.0 of the New Relic Python agent, however, includes an exciting new feature for developers working on any framework that uses Python’s asyncio library: event loop diagnostics. With this capability, the Python agent now surfaces information about transactions that have waited a significant amount of time to acquire control of the event loop, allowing developers to better interpret what’s happening in, or slowing down, their asynchronous Python applications.
The problem we’re solving
To better understand the problem that this feature addresses, consider the following:
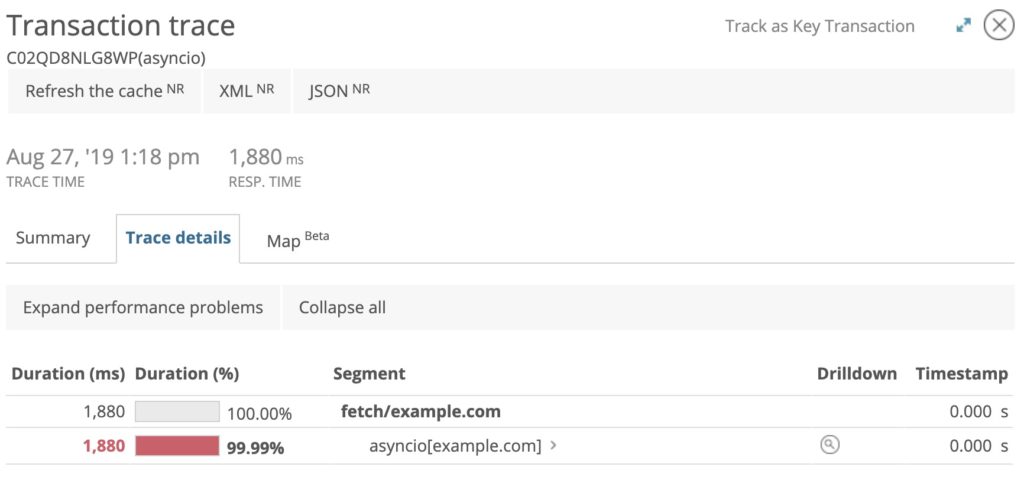
Imagine you’re running an asynchronous Python application, and you get an alert from New Relic about a slow transaction. If you check the transaction trace in New Relic, you might see:
Clearly a response time of 1,880 ms isn’t good—but what does this mean? What’s slowing down the application code? Is it even the code that’s slow?
Generally, there are three possible explanations for why the async app seems slow:
- The network has slowed, and it’s taking a long time to get a response from the other server in the transaction.
- The function has blocking work within it, causing it to be slow.
- Some other work is blocking the event loop, causing slowdowns for other work in the event loop.
In the majority of cases involving asynchronous Python applications, however, explanation #3 is the most difficult to detect and diagnose. Your application is behaving normally, but the transaction trace doesn’t explain the actual execution time for your application, nor does it reveal any information about what’s blocking the event loop.
Enter event loop diagnostics.
How event loop diagnostics work in New Relic
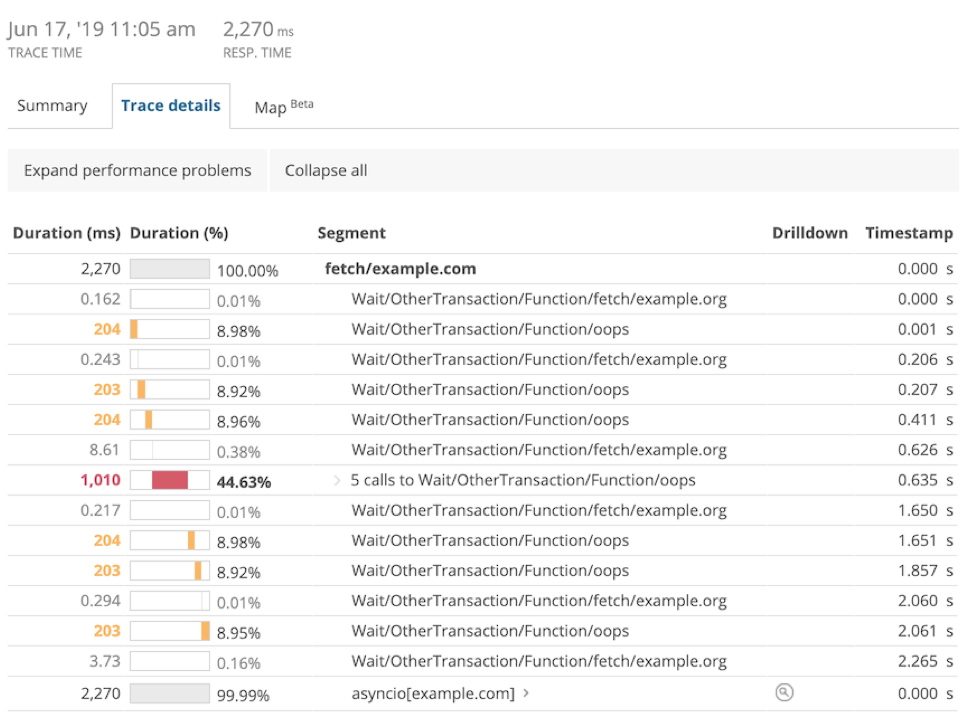
To provide the actual execution time and show what’s blocking the event loop, New Relic APM 360 now tracks all trace segments executing on the event loop. APM records wait times by adding a wait segment at the root of a blocked transaction while subtracting that time from all of its active segments. This way, APM can gather information about any potential blockers for any traces and how much time is spent waiting for other traces to complete.
Event loop diagnostic information is available in APM and via New Relic Query Language (NRQL) queries.
Event loop metrics will appear in the transaction Breakdown table in APM:
Time spent waiting on other transactions will be shown in the transaction Trace details page:
Additionally eventLoopTime and eventLoopWait attributes will be available via NRQL queries, the results of which you can display in New Relic Insights. For example:
SELECT count(*) as 'count', average(eventLoopTime) as 'loopTime', average(eventLoopWait) as 'loopWait' FROM Transaction facet name
Conclusion
Event loop diagnostics are available by default through our existing aiohttp, Sanic, and Tornado instrumentation. Diagnostic information is available for coroutines that use our background_task and web_transaction decorator APIs. If you’re using Tornado, we support instrumentation for version 6.x, and we’ll be adding Tornado 5.x support soon. Data from the Tornado web server, framework, and HTTP client will show up in both APM and Insights.
Reach out on the New Relic Explorer Hub, and let us know about your experience using event loop diagnostics in New Relic.In the meantime, learn about exporting with Python and the NerdGraph API.
Interested in New Relic's other platforms? Check out our Infrastructure monitoring web applications.
The views expressed on this blog are those of the author and do not necessarily reflect the views of New Relic. Any solutions offered by the author are environment-specific and not part of the commercial solutions or support offered by New Relic. Please join us exclusively at the Explorers Hub (discuss.newrelic.com) for questions and support related to this blog post. This blog may contain links to content on third-party sites. By providing such links, New Relic does not adopt, guarantee, approve or endorse the information, views or products available on such sites.


