The following is adapted from a series of best practice guides that reflect the New Relic Community Team’s work with thousands of customers—identifying challenges and coming up with actionable solutions for organizations getting started with New Relic APM 360. Also, check out our guides to getting started with New Relic Infrastructure, New Relic Mobile, New Relic Insights, New Relic Browser, and New Relic Synthetics; and discover the New Relic Community Team’s latest Best Practice Guide offerings.
In today’s digital world, the success of your applications often determines the success of your business. That makes Application Performance Monitoring (APM) more important than ever—you have to know exactly what your applications and systems are doing at all times. You need visibility to spot anomalies early, before your customers do. APM gives you the power to truly understand your digital business.
New Relic APM 360 is designed to give you high quality insights into each of your applications to help you identify exactly what you need to do to keep them running and improve their performance. But what exactly should you do first? The faster you can configure APM to your liking and get comfortable working with it, the faster your team and business—and, in turn, your customers—will recognize its full value.
In this post, you’ll find answers to the most common questions we’ve received from New Relic APM users as they move from implementing APM to using it every day. (After reviewing these best practices—and, when possible, actually working with them in your organization's own environment—you’ll be ready to demonstrate your new APM skills by taking our APM Best Practices Quiz and earning your proficiency badge!)
Let’s dive into our list of best practices. Feel free to skip around based on your needs and interests, although we think every item on the list will be valuable for most new APM users. (Tip: As a first step, review these short videos to help you get the lay of the land with New Relic APM.)
Getting started with New Relic APM
Create a naming convention for your applications
When multiple applications run on the same account, and each application spans multiple environments (for example, development, test, pre-production, and production), it can be hard to find a specific application in your overview dashboard.
We recommend establishing a naming convention for your apps and using labels to facilitate search and filter tasks. Use a naming convention like <environment>-<appname>-<language> to make it easier to spot patterns in your data.
Learn more about application naming conventions, including how to rename your app and how to use labeling:
- Name Your Application
- Labels and Categories: Organize Apps and Monitors
- What’s in an App Name? How to Create an App-Naming Convention
Set up account and user access
New Relic users often find it helpful to create a hierarchy of accounts and sub-accounts for different applications. Admins can use this approach, for example, to allow users to view only apps relevant to their group. The account owner or admins can also apply and manage granular access controls for users at the sub-account level.
Learn more about New Relic APM account and user access controls:
- Master and Sub Account Hierarchy
- Relic Solution: New Relic Account Architecture and Moving Accounts
- Relic Solution: SAML SSO Tips
- Add-on Roles
Use APM to understand your customer experience
Get acquainted with Apdex
The APM Application overview page displays a number of charts, and you may not be sure where to start the process of troubleshooting application performance issues.
It’s common to see correlations in the behavior of certain charts on the overview page. For example, higher than normal application throughput might coincide with a spike in response times, or you might observe slower transactions that coincide with a high error rate. Most of these charts have something else in common, too: They impact Apdex, which is an industry-standard measurement of application performance.
You’ll find the Apdex score in the upper-right corner of the Overview Page.
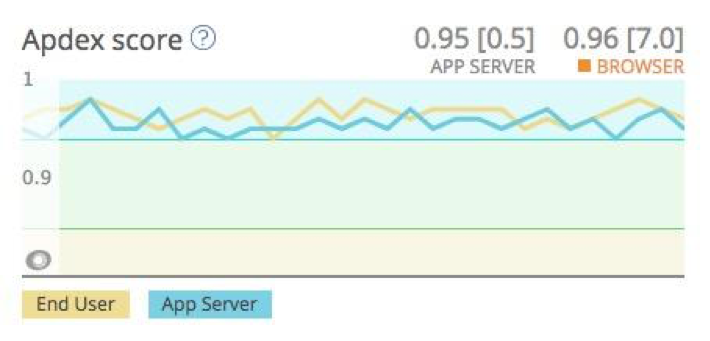
The score, which is a value between 0 and 1, represents an at-a-glance summary of how your applications are performing. To use Apdex, you’ll need to set an ideal value based on your application’s performance history and the needs of your user base. Apdex will then translate and categorize its numerical scores, based on transaction response times, into groups of “Satisfied,” “Tolerating,” and “Frustrated” users. This gives you a clear and simple way to determine whether application performance issues are degrading your customer experience.
Analyze and resolve errors
Sooner or later, you’re likely to encounter one of the application performance issues discussed here. For example, you might notice a sudden increase in application errors. What comes next? How do you actually fix the problem?
In the left-hand column of the main APM page, under "Events," find and click on Error Analytics. Here you’ll see an breakdown of error counts by type.

Click into any error count to open its error trace. Each error trace captures a wealth of data for a particular error, including the returned HTTP response code and a stack trace. Any custom attributes that you set up are also visible here. All of these data resources can help you to locate errors in your technology stack and to resolve them more quickly.
In addition to error traces, transaction traces are helpful to investigate slow transactions; and with its new Distributed Tracing capabilities, New Relic APM enables visibility across your entire stack to understand where transactions are slowing down—a critical indicator that application performance issues may be putting your customer experience, and thus your customer relationships, at risk. And of course, identifying the problem is a necessary first step towards fixing it.

Learn more about using New Relic APM to understand and elevate your customers' digital experience:
- Error Analytics: Explore the Events Behind the Errors
- Error Analytics: Manage Error Traces
- Getting Started with New Relic Distributed Tracing
Use New Relic APM to make your application performance data actionable
Create a Dashboard with key NRQL queries
New Relic Insights brings all of your application performance data into a single environment. New Relic Query Language (NRQL) gives you the power to ask important questions of this data—and to get useful answers in an instant.
We recommend two exercises that designed to make you more comfortable working with Insights and NRQL—including the process of working with custom attributes to shape the default dataset to meet your needs. Try running each of the following NRQL queries in Insights, and then modify them to make them more relevant and responsive to your organization’s specific needs.
Query to report the percentage of erroring transactions per application:
FROM Transaction SELECT percentage(count(*), WHERE error IS FALSE) AS 'Good', percentage(count(*), WHERE error IS TRUE) AS 'Errors', percentage(count(*), WHERE error IS NULL) AS 'Unknowns' SINCE 2 days ago facet appName
Query to report transaction response times during the previous hour:
FROM Transaction SELECT average(duration) SINCE 1 HOUR AGO facet appName TIMESERIES MAX
Learn more about using New Relic Insights:
Set up New Relic Alerts
Alerts are one of the most important factors in the application monitoring process: Monitoring is less useful if you don’t know when your applications are misbehaving. New Relic Alerts allows you to configure notifications using a variety of popular messaging and communication platforms (including Slack, OpsGenie, and PagerDuty, among others), as well as a generic webhook to which you can send notifications.
When setting alerts in APM, we recommend defining at least three alert conditions: one where Apdex falls below an acceptable level; one where response times exceed a specific threshold; and one where error rates exceed a specific level.

Keep in mind that the proper thresholds for these conditions will depend on what you consider to be abnormal and unacceptable for your application; you'll want to experiment with them to answer this question.
Learn more about using New Relic Alerts:
- Effective Alerting in Practice
- Intro to APM Alerting
- Relic Solution: Alert Incident Preferences are the Key to Consistent Alert Notifications
Ready to learn more?
Looking for more New Relic APM best practices and tips? Check out our Level Up: Relic Solutions page for a wealth of community-generated resources on these and related topics. And when you feel you're ready, test your new APM skills by taking our APM Best Practices Quiz and earning your proficiency badge!
![]()

The views expressed on this blog are those of the author and do not necessarily reflect the views of New Relic. Any solutions offered by the author are environment-specific and not part of the commercial solutions or support offered by New Relic. Please join us exclusively at the Explorers Hub (discuss.newrelic.com) for questions and support related to this blog post. This blog may contain links to content on third-party sites. By providing such links, New Relic does not adopt, guarantee, approve or endorse the information, views or products available on such sites.


