This post was updated from a previous version published in April 2019.
Kubernetes has emerged as the de facto standard for orchestrating and managing application containers. Virtually all the significant players in the cloud-native application space—many of them fierce competitors—have thrown their support behind Kubernetes as an industry standard.
Here at New Relic, the Kubernetes story boils down to a couple of very strategic points. First, we believe that for all of its success to date, Kubernetes is actually—and amazingly—still in its early journey towards achieving its full potential. Tomorrow’s Kubernetes environments will operate at a scale that will dwarf what we see today. As Kubernetes environments continue to scale, they will also continue to get more complex—and to present bigger challenges for efforts to monitor their performance and health.
Second, many of our customers tell us they get tremendous value by leveraging New Relic’s observability platform as they transition to running their application workloads in Kubernetes. That’s why we’re thrilled to provide instant Kubernetes observability delivered by Auto-telemetry with Pixie.
You no longer need to manually instrument your applications, update your code, redeploy your apps, or navigate long organizational standardization processes. Now, you can monitor your Kubernetes clusters and workloads in minutes and debug your applications faster than ever.
What is Kubernetes application monitoring?
Kubernetes application monitoring involves collecting, analyzing, and visualizing data related to the performance and health of applications deployed on a Kubernetes cluster. Kubernetes application monitoring helps organizations gain insights into the health and performance of their applications, troubleshoot issues more efficiently, and ensure a better overall user experience.
Why is Kubernetes application monitoring important?
Kubernetes application monitoring is a proactive and essential practice for maintaining the health and performance of applications in dynamic, containerized, and microservices-based environments. It enables organizations to respond quickly to issues, optimize resource usage, and deliver a reliable and efficient user experience.
Kubernetes application monitoring challenges
While Kubernetes excels at abstracting away much of the toil associated with managing containerized workloads, it also introduces some complexities of its own. The Kubernetes environment includes an additional layer that comes into play between the application and the underlying infrastructure. The challenge of monitoring and maintaining the performance and health of these Kubernetes environments, or of troubleshooting issues when they occur, can be daunting—especially as organizations deploy these environments at massive scale.
New Relic as a solution
To help you succeed, New Relic is all in on Kubernetes, which is why we have been steadily expanding and upgrading our ability to instrument, monitor, and deliver observability across your Kubernetes clusters. That begins with setting up instrumentation quickly and easily. Then you can analyze the performance and health of your clusters (nodes, containers, application, and more) to identify and troubleshoot performance issues.
Key Kubernetes performance metrics to monitor
Monitoring the right metrics in a Kubernetes environment is crucial for understanding the health and performance of both the cluster and the applications running on it. Here are some key Kubernetes metrics to monitor:
| Metric Category | Metric Name | Description |
|---|---|---|
| Node Metrics | CPU Usage | Percentage of CPU utilized on each node. |
| Memory Usage | Percentage of memory used on each node. | |
| Disk I/O | Input/output operations on node disks. | |
| Network I/O | Input/output operations on the node's network interface. | |
| Pod Metrics | CPU Usage | CPU usage percentage for each pod. |
| Memory Usage | Memory usage percentage for each pod. | |
| Network I/O | Input/output operations on the pod's network interface. | |
| Container Metrics | CPU Usage | CPU usage percentage for each container within a pod. |
| Memory Usage | Memory usage for each container within a pod. | |
| Cluster Metrics | Cluster CPU Usage | Aggregated CPU usage across all nodes in the cluster. |
| Cluster Memory Usage | Aggregated memory usage across all nodes in the cluster. | |
| Cluster Network I/O | Aggregated network input/output across all nodes in the cluster. | |
| Kubelet Metrics | Kubelet Health and Status | Health and status of the Kubelet on each node. |
| Kubelet API Server Metrics | Metrics related to communication between the Kubelet and the Kubernetes API server. | |
| Kubernetes Control Plane | API Server Metrics | Health, latency, and request/response rates of the Kubernetes API server. |
| Controller Manager Metrics | Metrics related to controller manager operations. | |
| Scheduler Metrics | Performance of the Kubernetes scheduler. | |
| ETCD Metrics | ETCD Cluster Health | Health and status of the distributed key-value store used by Kubernetes. |
| ETCD Disk Usage | Disk space usage of the ETCD cluster. | |
| Service Metrics | Service Latency | Latency of services within the cluster. |
| Service Throughput | Rate of requests handled by services. | |
| Ingress Metrics | Ingress Controller Metrics | Performance and health of the Ingress controller. |
| Ingress Latency | Latency of incoming requests through the Ingress. | |
| Custom Application Metrics | Custom Application Metrics | Metrics specific to applications, such as request latency, error rates, and custom business metrics. |
Learn more about clusters, nodes, and pods.
Choosing a tool for monitoring Kubernetes application performance
Choosing the right tool to monitor your Kubernetes environment makes all the difference when managing and optimizing your containerized applications. Here are some key considerations to guide you:
Compatability and integration: Ensure that the tool is fully compatible with Kubernetes and can seamlessly integrate with your existing infrastructure. Check for support for your Kubernetes version and other tools you use like CI/CD pipelines, cloud services, and container registries.
Comprehensive monitoring capabilities: Look for a tool that offers a wide range of monitoring capabilities, including:
- Container performance: CPU, memory, and network usage of pods and nodes.
- Application health: Real-time monitoring of application health and performance.
- Cluster health: Monitoring the status and health of the entire Kubernetes cluster.
- Logs and events: Collection and analysis of logs and events for debugging and auditing purposes.
Customizability and scalability: The tool should be customizable to suit your specific monitoring needs and scalable to accommodate your application's growth. It should allow you to set custom metrics, alerts, and thresholds based on your application's behavior.
User-friendly interface: A user-friendly dashboard that provides a clear overview of your Kubernetes environment, making it easy to visualize metrics, logs, and alerts. This is particularly important for quickly identifying and resolving issues.
Remember, there is no one-size-fits-all solution for Kubernetes monitoring. Your choice should be guided by your organization's specific requirements, the size and complexity of your Kubernetes environment, and your team's expertise.
How to use New Relic for Kubernetes application monitoring
By design, applications typically aren’t aware of whether they’re running in a container or on an orchestration platform. A Java web application, for example, doesn’t have any special code paths that get executed only when running inside a Docker container on a Kubernetes cluster.
This is a key benefit of containers (and container orchestration engines): your application and its business logic are decoupled from the specific details of its runtime environment. If you ever have to shift the underlying infrastructure to a new container runtime or Linux version, you won’t have to completely rewrite the application code.
Similarly, neither Auto-telemetry with Pixie nor our Application Performance Monitoring (APM) language agents care where an application is running. It could be running on an ancient Linux server in a forgotten rack or on the latest Amazon Elastic Compute Cloud (Amazon EC2) instance. However, when monitoring applications managed by an orchestration layer, it’s very useful for debugging or troubleshooting to be able to relate an application error trace, for example, to the container, pod, or host that it’s running on.
All of these are must-have capabilities for a Kubernetes application monitoring solution because they help you answer an all-too-common question: Does a performance problem really reside in the code, or is it actually tied to the underlying infrastructure?
How to link Kubernetes metadata to application instrumentation
Traditionally, for application transaction traces or distributed traces, New Relic APM agents tell you exactly which server the code was running on. However, this gets more complex in container environments: the worker nodes (hosts) where the application runs (in the containers/pods) are often ephemeral—they come and go.
It’s fairly common to configure policies for applications running in Kubernetes to automatically scale their host count in response to traffic fluctuations, so you may investigate a slow transaction trace, but the container or host where that application was running no longer exists. Knowing the containers or hosts where the application is currently running is not necessarily an indication of where it was running 5, 15, or 30 minutes ago—when the issue occurred.
But, with New Relic, you can link Kubernetes metadata to your application performance data as transaction traces in order to debug application transaction errors. And Auto-telemetry with Pixie means that you don’t even have to install an APM language agent, making this the easiest way to get started. If you’re already using language agents, continue reading for how to link this data.
Getting started with Kubernetes observability
There are a few compatibilities and requirements you’ll want to review before getting started. For example, your cluster needs to have the MutatingAdmissionWebhook controller enabled (it might not be enabled by default). And be sure to review which APM agents can be linked to Kubernetes metadata.
To inject Kubernetes metadata into your agent:
- Download the following yaml file:
curl -O http://download.newrelic.com/infrastructure_agent/integrations/kubernetes/k8s-metadata-injection-latest.yaml
- Edit this file, replacing
<YOUR_CLUSTER_NAME>with the name of your cluster. - Apply the yaml file to your Kubernetes cluster:
kubectl apply -f k8s-metadata-injection-latest.yaml
After you have the injection file in place, you can optionally limit the injection of metadata to specific namespaces in your cluster, or configure the metadata injection to work with custom certificates, if you’re using them. For more information, including steps for validating and troubleshooting metadata injection, see our documentation.
Note: Our Kubernetes metadata injection project is open source. Here's the code to link APM and Infrastructure and the code to automatically manage certificates.
Exploring application performance in Kubernetes
After deploying the metadata injection file to our Kubernetes cluster, custom parameters from Kubernetes begin to appear in the New Relic UI.
In the following screen capture, you can see that the transaction attributes show the Kubernetes hostname and the IP address where the error occurred, among other details:

The same metadata shows up under Distributed Trace attributes.
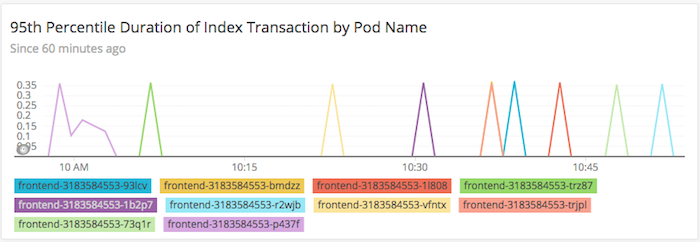
Next, we queried our data to see the performance of application transactions based on pod names by writing the following custom New Relic Query Language (NRQL) query:
SELECT percentile(duration, 95) from Transaction where
appName='newrelic-k8s-node-redis' and
name='WebTransaction/Expressjs/GET//'FACET K8S_POD_NAME TIMESERIES
auto
And here’s the result:

Kubernetes exposes a good deal of useful metadata you can use to gain helpful information about performance outliers and track down individual errors.
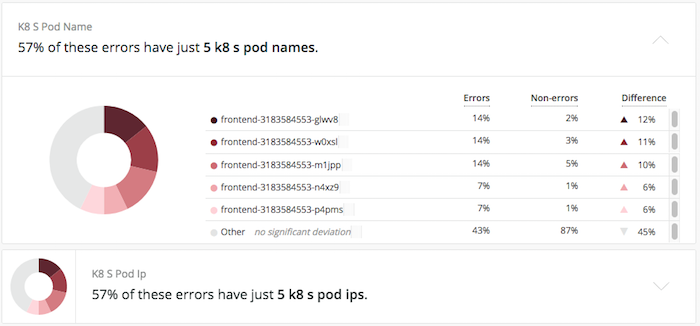
In the following example, notice how the APM error profile automatically identifies that nearly 57% of errors come from the same pods and pod IP addresses:

APM error profiles automatically incorporate custom parameters and use different statistical measures to determine if an unusual number of errors is coming from a certain pod, IP, or host within the container cluster. From there, you can zero in on infrastructure- or cluster-specific root causes of the errors (or maybe you’ll just discover some bad code).
APM and the Kubernetes cluster explorer
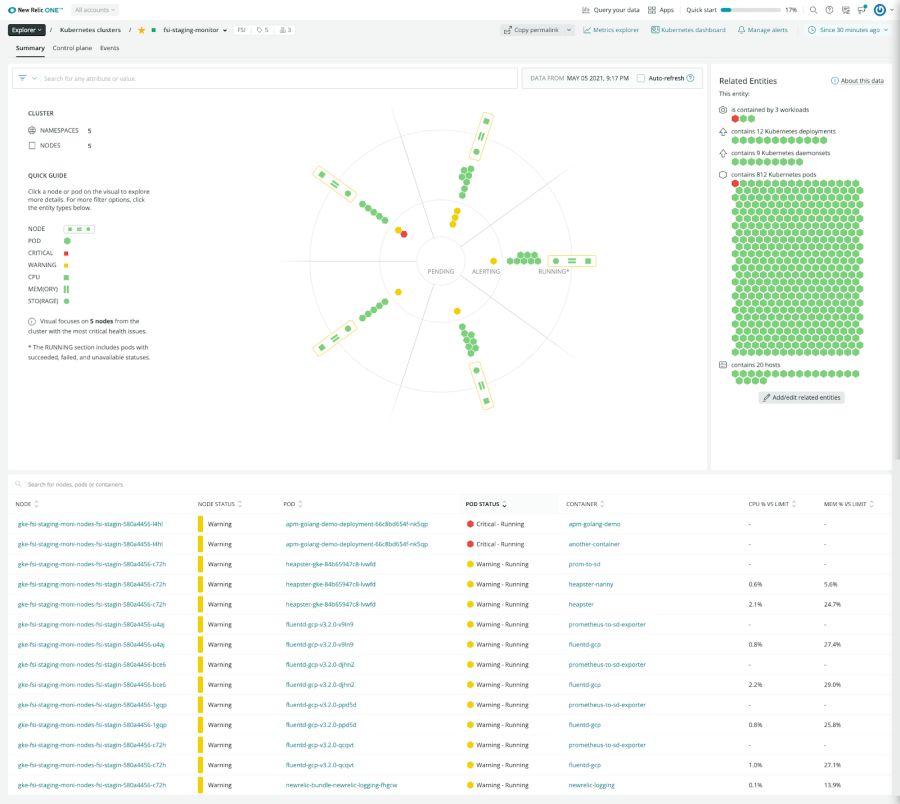
If you start investigating issues beginning with your infrastructure, Kubernetes cluster explorer shows you application performance metrics in a single, connected experience. If you identify issues within a node or a pod that aren’t driven by the underlying infrastructure, the root cause might lie within your application, impacting throughput, response time, error rate, and violations.

Use Kubernetes cluster explorer to get visibility into applications and infrastructure metrics.
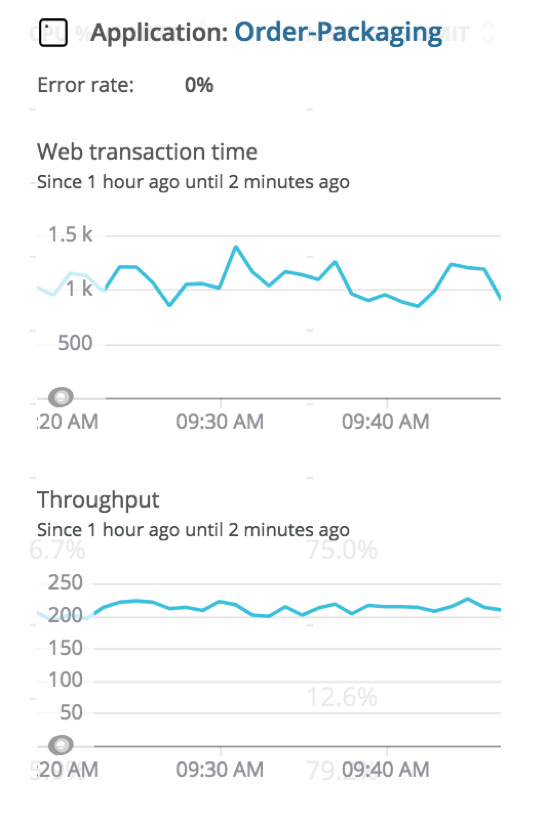
Effectively monitoring applications running in Kubernetes requires not just code-level visibility into applications, but also the ability to correlate applications with the containers, pods, or hosts in which they’re running. By identifying pod-specific performance issues for an application’s workload, you can troubleshoot performance issues faster and have confidence that your application is always available, running fast, and doing what it is supposed to do.

Kubernetes cluster explorer gives you an understanding of how your application is performing. Clicking on the application (in this case, Order-Packaging) opens the APM overview page where you can troubleshoot and debug that specific application.
A few Kubernetes application monitoring best practices
Implementing effective Kubernetes application monitoring involves adopting best practices to ensure comprehensive coverage, timely issue detection, and efficient troubleshooting. The following practices cover the essentials for a robust Kubernetes application monitoring strategy, ensuring proactive issue identification, efficient troubleshooting, and continuous improvement:
Define monitoring objectives:
Clearly outline monitoring objectives, including critical metrics, KPIs, and alerting thresholds aligned with application and business goals.
Comprehensive metric collection:
Collect a diverse set of metrics covering infrastructure, nodes, pods, containers, and custom application metrics for a holistic view of performance.
Centralized logging:
Implement centralized logging to analyze logs and identify Kubernetes issues, errors, and anomalies across applications and infrastructure.
Set up A\alerts and notifications:
Establish actionable alerts with well-defined thresholds to receive timely notifications for prompt issue detection and resolution.
Monitoring Kubernetes components:
Monitor the health and performance of key Kubernetes components, ensuring the stability of the overall cluster.
Custom application metrics:
Define and monitor custom application metrics to gain insights into specific application behavior and performance.
Regularly review and update monitoring configuration:
Periodically review and update monitoring configurations to adapt to changes in applications or infrastructure and incorporate feedback from incident investigations.
Capacity planning:
Use monitoring data for capacity planning, predicting resource demands, and scaling infrastructure to avoid performance degradation.
Your customers may not care about Kubernetes … but you should
Your customers likely don’t care if you’re using traditional virtual machines; a bleeding-edge, multi-cloud federated Kubernetes cluster; or a home-grown artisanal orchestration layer. They just want the applications and services you provide to be available, reliable, and fast.
But with the rise of Kubernetes, you need the ability to understand and explore your cluster and application performance quickly so you can deliver the best experiences to your customers.
Next steps
Take a look at our hub of Kubernetes resources:
Learn how to monitor and tune Kubernetes performance
Learn how to manage your cluster capacity with Kubernetes requests and limits.
Create, use, and manage Kubernetes secrets using our guide.
The views expressed on this blog are those of the author and do not necessarily reflect the views of New Relic. Any solutions offered by the author are environment-specific and not part of the commercial solutions or support offered by New Relic. Please join us exclusively at the Explorers Hub (discuss.newrelic.com) for questions and support related to this blog post. This blog may contain links to content on third-party sites. By providing such links, New Relic does not adopt, guarantee, approve or endorse the information, views or products available on such sites.


