At New Relic, we encourage our customers to extend our platform and to make New Relic truly their own. That’s exactly what one engineering team at GEP did after attending a presentation on Best Practices for Measuring your Code Pipeline, by New Relic Senior Solution Consultant Eric Mittelhammer, at a recent FutureStack event. The team from GEP returned home to their New Jersey office, eager to put New Relic to use in monitoring their code development lifecycle.
Procurement technology and services leader GEP provides strategy, software, and managed services to help enterprise procurement and supply chain professionals transform and create value for their businesses. SMART by GEP—the focus of the GEP team featured in this case study—is a cloud-native, end-to-end software platform designed to streamline all aspects of the procurement process.
After the FutureStack presentation (also available as a webinar), the SMART by GEP engineering team built a proof of concept for its own custom measurement solution, using the example code from the presentation. The team wanted to measure six key metrics:
- Commits based on product
- Commits based on branch (dev/release/hotfix)
- Commits per user
- Files modified per commit
- Comparison of commits
- Lines of code changed
Drawing on New Relic’s code pipeline example
Best Practices for Measuring Your Code Pipeline and its example code rely on a few services from Amazon Web Services (AWS), including AWS CodePipeline—an automated continuous delivery service—and AWS Lambda functions. When a developer pushes code to GitHub, a webhook notifies CodePipeline, which then tags the commit and either kicks off tests or deploys the code. A tag, test, or deploy triggers a Lambda function that formats and sends the CodePipeline data to the New Relic Insights API. From there, developers can run New Relic Query Language (NRQL) queries to visualize the data in a New Relic Insights dashboard. Additionally, when a developer makes that initial push to GitHub, a separate webhook sends the push event to a Lambda function that preps and sends the data to the Insights API.

The SMART by GEP team uses Microsoft Azure instead of AWS, but with help from New Relic expert consultants, the team created an equivalent pipeline in Azure.

The team created an Azure Function that consumes a GitHub webhook. When they push a commit to their repo, the webhook triggers an Azure Function, which formats and sends the data to the Insights API. The team then runs NRQL queries to create their visualizations, just like in the original example.
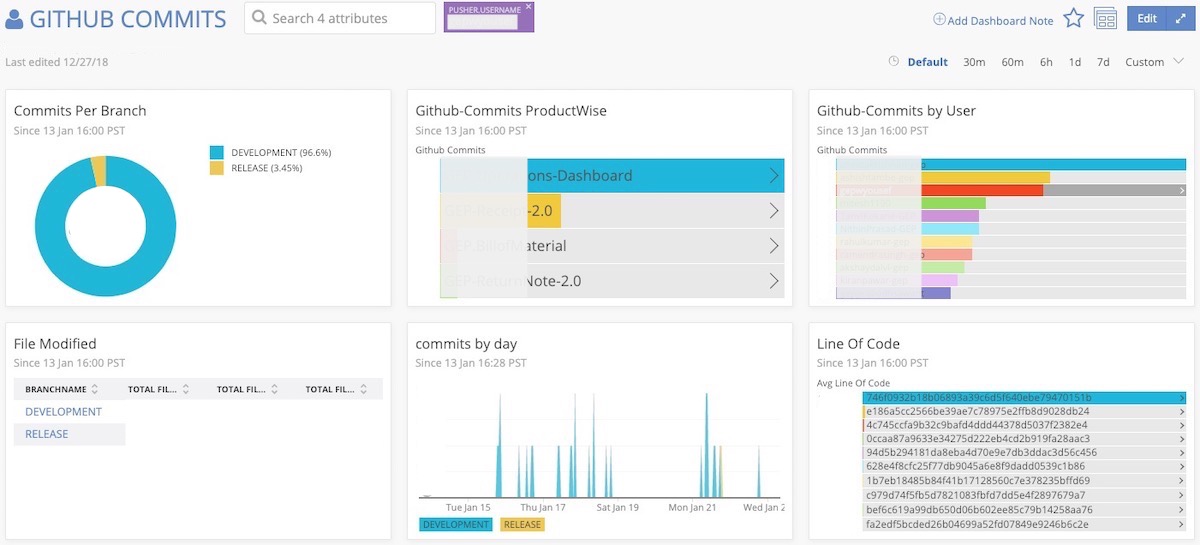
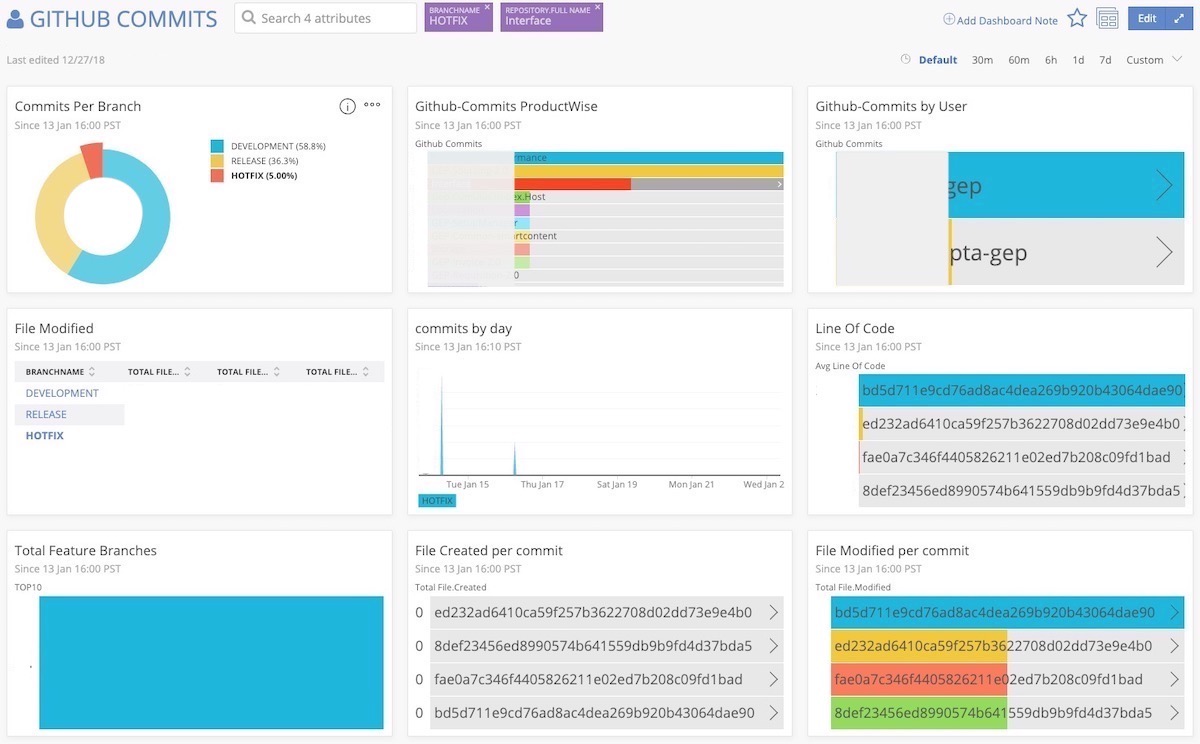
After building their code measurement pipeline, the team reviewed the metrics they collected. The team’s GitHub Commits dashboard (shown below) showcases an overall view of the application's code, which is collected from its GitHub repository. The dashboard gives the team a holistic view of all the code changes they make, and it allows them to track those changes as code moves through the development lifecycle—from development to release branches.

Let’s take a closer look at some specific metrics the SMART by GEP team measured with its New Relic proof of concept solution.
How are developers spending their time?
When you’re measuring the value of your development practices, it’s important to understand where you’re focusing your efforts. Widgets like GitHub Commits by User and Total Feature Branches help the team determine which user committed code for a particular branch. Drilling down, the team can see which files have been modified on that branch and which user wrote which lines of code. With the Commits Per Branch chart, the team can see how much time they devoted to working on code that had already been released.

How efficient are developers?
When your goal is to improve team efficiency, a dashboard that captures your team’s code lifecycle is invaluable. For example, the GEP team’s engineering managers use the Commits Per Branch chart to learn which branches specific developers focus on and how efficiently developers work. If a developer spends time in release or hotfix branches, managers use that as an indication that the code may not be developed efficiently or tested adequately before it enters production.
What files are developers modifying?
When your code reviews aren’t meaningful, developers may miss errors—and when that faulty code lands in production, developers then have to spend time fixing code instead of developing new features. For the team, limiting the number of file modifications per commit is a crucial metric for determining the health of the code they commit. Modifying fewer files in a commit makes for more meaningful code reviews and a more predictable development lifecycle. Conversely, too many modifications in a commit suggests the code isn’t being properly vetted—and it could easily end up in a hotfix branch at some point in the future.
The team uses the Files Modified and Line of Code charts to track the quality of the code they push to production. As noted above, they can use the same charts to track metrics like developer effort; for example, if a fix on a hotfix branch required only a few lines of code, the team can assume developers needed less effort to fix whatever issue had occurred in the code.
Combatting “branching horror”
When visualized, git branches resemble tree branches, and sometimes, those branches need careful pruning. The team wanted to eliminate the possibility of "branching horrors"—making it as easy as possible to navigate and track changes through all of the branches and code versions in their repository. Reducing the number of branches, the team decided, would speed their development process and improve their code-health metrics.

Visualizing these branching issues in the team's dashboard helped them come to terms with their own "branching horrors" by moving quickly to reduce the number of unused branches.
Proving the value of code pipeline measurement best practices
The GitHub Commits dashboard succeeded as a proof-of-concept for the team—allowing them to reduce inefficient code practices. The team shared their integration and dashboards with other GEP engineers worldwide, and they continue to push for better code-pipeline practices using New Relic.
Tracking GitHub commits by user, files modified by commit, or the number of unused branches in an enterprise repo may not be standard use cases for New Relic, but this fact actually illustrates the versatility of the New Relic platform. Beyond this innovative application, the ability to harness data with NRQL, New Relic Insights, and custom dashboards—and to use this data to perform advanced analytics—allows developers to take their monitoring and analysis practices in new and valuable directions.
Procurement technology and services leader GEP provides strategy, software, and managed services to help enterprise procurement and supply chain professionals transform and create value for their businesses. SMART by GEP—the focus of the GEP team featured in this case study—is a cloud-native, end-to-end software platform designed to streamline all aspects of the procurement process.
After the FutureStack presentation (also available as a webinar), the SMART by GEP engineering team built a proof of concept for its own custom measurement solution, using the example code from the presentation. The team wanted to measure six key metrics:
- Commits based on product
- Commits based on branch (dev/release/hotfix)
- Commits per user
- Files modified per commit
- Comparison of commits
- Lines of code changed
Drawing on New Relic’s code pipeline example
Best Practices for Measuring Your Code Pipeline and its example code rely on a few services from Amazon Web Services (AWS), including AWS CodePipeline—an automated continuous delivery service—and AWS Lambda functions. When a developer pushes code to GitHub, a webhook notifies CodePipeline, which then tags the commit and either kicks off tests or deploys the code. A tag, test, or deploy triggers a Lambda function that formats and sends the CodePipeline data to the New Relic Insights API. From there, developers can run New Relic Query Language (NRQL) queries to visualize the data in a New Relic Insights dashboard. Additionally, when a developer makes that initial push to GitHub, a separate webhook sends the push event to a Lambda function that preps and sends the data to the Insights API.
The SMART by GEP team uses Microsoft Azure instead of AWS, but with help from New Relic expert consultants, the team created an equivalent pipeline in Azure.
The team created an Azure Function that consumes a GitHub webhook. When they push a commit to their repo, the webhook triggers an Azure Function, which formats and sends the data to the Insights API. The team then runs NRQL queries to create their visualizations, just like in the original example.
After building their code measurement pipeline, the team reviewed the metrics they collected. The team’s GitHub Commits dashboard (shown below) showcases an overall view of the application's code, which is collected from its GitHub repository. The dashboard gives the team a holistic view of all the code changes they make, and it allows them to track those changes as code moves through the development lifecycle—from development to release branches.
Let’s take a closer look at some specific metrics the SMART by GEP team measured with its New Relic proof of concept solution.
How are developers spending their time?
When you’re measuring the value of your development practices, it’s important to understand where you’re focusing your efforts. Widgets like GitHub Commits by User and Total Feature Branches help the team determine which user committed code for a particular branch. Drilling down, the team can see which files have been modified on that branch and which user wrote which lines of code. With the Commits Per Branch chart, the team can see how much time they devoted to working on code that had already been released.
How efficient are developers?
When your goal is to improve team efficiency, a dashboard that captures your team’s code lifecycle is invaluable. For example, the GEP team’s engineering managers use the Commits Per Branch chart to learn which branches specific developers focus on and how efficiently developers work. If a developer spends time in release or hotfix branches, managers use that as an indication that the code may not be developed efficiently or tested adequately before it enters production.
What files are developers modifying?
When your code reviews aren’t meaningful, developers may miss errors—and when that faulty code lands in production, developers then have to spend time fixing code instead of developing new features. For the team, limiting the number of file modifications per commit is a crucial metric for determining the health of the code they commit. Modifying fewer files in a commit makes for more meaningful code reviews and a more predictable development lifecycle. Conversely, too many modifications in a commit suggests the code isn’t being properly vetted—and it could easily end up in a hotfix branch at some point in the future.
The team uses the Files Modified and Line of Code charts to track the quality of the code they push to production. As noted above, they can use the same charts to track metrics like developer effort; for example, if a fix on a hotfix branch required only a few lines of code, the team can assume developers needed less effort to fix whatever issue had occurred in the code.
Combatting “branching horror”
When visualized, git branches resemble tree branches, and sometimes, those branches need careful pruning. The team wanted to eliminate the possibility of "branching horrors"—making it as easy as possible to navigate and track changes through all of the branches and code versions in their repository. Reducing the number of branches, the team decided, would speed their development process and improve their code-health metrics.
Visualizing these branching issues in the team's dashboard helped them come to terms with their own "branching horrors" by moving quickly to reduce the number of unused branches.
Proving the value of code pipeline measurement best practices
The GitHub Commits dashboard succeeded as a proof-of-concept for the team—allowing them to reduce inefficient code practices. The team shared their integration and dashboards with other GEP engineers worldwide, and they continue to push for better code-pipeline practices using New Relic.
Tracking GitHub commits by user, files modified by commit, or the number of unused branches in an enterprise repo may not be standard use cases for New Relic, but this fact actually illustrates the versatility of the New Relic platform. Beyond this innovative application, the ability to harness data with NRQL, New Relic Insights, and custom dashboards—and to use this data to perform advanced analytics—allows developers to take their monitoring and analysis practices in new and valuable directions.

The views expressed on this blog are those of the author and do not necessarily reflect the views of New Relic. Any solutions offered by the author are environment-specific and not part of the commercial solutions or support offered by New Relic. Please join us exclusively at the Explorers Hub (discuss.newrelic.com) for questions and support related to this blog post. This blog may contain links to content on third-party sites. By providing such links, New Relic does not adopt, guarantee, approve or endorse the information, views or products available on such sites.


