Do you want to understand your New Relic data better? New Relic Query Language (NRQL) can help. NRQL lets you analyze your data in real time. Although it can seem overwhelming at first glance, worry not. In this two-part blog, we'll cover 10 essential NRQL functions and clauses that will help you understand NRQL better and gain deeper insights into your data. These functions and clauses can help you calculate percentages, create heatmaps, create conditional widgets, and so much more. By using NRQL, you can get more out of your data analysis. Let's get started and learn how to use NRQL to gain valuable insights from your data.
Number 1: Select X from Y
SELECT X from Y , FROM Y SELECT X
the easiest way to query anything. Every NRQL query will begin with a SELECT statement or a FROM clause. It’s best to start your initial query with FROM, this shows you a list of the values for the event/metric available to you, and SELECT specifies what portion of a data type you want to query by specifying an attribute or a function. For example, SELECT * FROM Transaction will get the values of all available attributes by using * as a wildcard.

To make use of the auto-suggestions from the query builder, use the FROM clause. For example, FROM Transaction SELECT transactionSubType will only suggest the relevant attribute of the selected dataset.

Every NRQL query must begin with a SELECT statement or a FROM clause. All other clauses are optional, but we could improve our initial query further to be specific with time range, to compare or add custom labels. Try the following:
SINCE
use the SINCE clause to define the beginning of a time range for the returned data. You can specify a time zone for the query but not for the results. NRQL results are based on your system time such as since 5 minutes ago , since 1 months ago limit max . Note: The default value is 1 hour ago.
UNTIL
use to specify an end point other than the default. Once a time range has been specified, the data will be preserved and can be reviewed after the time range has ended. Note: The default value is NOW.
Here's a useful scenario where we can combine SINCE and UNTIL to plot a time-series chart for max(duration) of transactions for 1 month minus today’s data:
FROM Transaction
SELECT MAX(duration)
WHERE appName = 'node-express-mongodb'
since 1 months ago until 1 DAY ago TIMESERIES auto

Note: It’s also possible to use absolute date time: SINCE ‘2022-10-10 09:00:00’ or UNTIL ‘2022-10-10 10:00:00’
COMPARE WITH
To compare the values for two different time ranges,COMPARE WITH requires a SINCE or UNTILstatement. The time specified byCOMPARE WITHis relative to the time specified by SINCE or UNTIL.For example,SINCE 1 day ago COMPARE WITH 1 day ago compares yesterday with the day before. Here's an example to compare the values for two different time ranges:
SELECT average(duration) FROM Transaction SINCE 1 DAY AGO COMPARE WITH 1 WEEK AGO

AS
The AS clause can be used to label an attribute, aggregator, or the result of a math function. This can be extremely helpful when creating charts, as it allows for the result of an equation or a query to be more clearly identified. The following is an example of a chart where AS has been used to label a data set. This label can make it easier to understand the results of the chart, as it clearly states the source of the data in the chart.
SELECT count(*)/uniqueCount(session) AS 'Pageviews per Session'
FROM PageView

Number 2: Math functions
NRQL allows you to use simple and complex math operators in a SELECT clause. You can use math calculations on individual attributes and also on the output of aggregator functions.
-
count :- Get the count of available records. This has similar SQL behaviour and counts all records for the given attribute.
FROM Transaction SELECT count(*)")
-
average , min, max :- Calculate the minimum, maximum, and average of an attribute. For example, check the Transaction duration
FROM Transaction
SELECT average(duration) ,max(duration), min(duration)
WHERE host LIKE '%west%'
, min() & max()")
-
percentage :- Calculate the percentage of a target data set. The first argument requires an aggregator function against the desired attribute.
FROM TRANSACTION
SELECT percentage(count(*), WHERE error IS true) AS 'Error Percent'
WHERE host LIKE '%west%' EXTRAPOLATE
-
percentile :- Calculate the percentile for the required attribute
FROM TRANSACTION
SELECT percentile(duration, 95, 75, 60)
WHERE host LIKE '%west%' EXTRAPOLATE

References
- Learn more about AGGREGATOR FUNCTIONS
Number 3: Timeseries
Use the TIMESERIES clause to get data as time series divided into chunks of time. These chunks of time are also called "buckets" and can be defined in seconds, minutes, hours, and more.
TIMESERIES keyword can be added to any query that's using aggregation function to plot the values over time.
    FROM Transaction
    SELECT MAX(duration)
    WHERE appName = 'node-express-mongodb'
    SINCE 1 MONTHS AGO
    TIMESERIES AUTO

You can also define the time slices for the series, such as TIMESERIES 30 seconds to capture data points in the series at 30 second intervals, TIMESERIES 1 minute to capture data points in the series at 1 minute intervals, and TIMESERIES max to capture all data points in the series without any defined interval. This allows you to customize the time slices of the series to whatever timeframe you prefer to work with.
References
- Learn more on TIMESERIES
Number 4: FACET (or group by)
FACET
Use facet to conditionally group your results by attribute values and separate it for each group. This can be helpful when you want to analyze your data by different categories or dimensions.
Here is a simple example using the FACET clause, where you can group the attribute PageView by the each city present in your dataset:
SELECT count(*) FROM PageView FACET city
The result of this query will show you the count of page views for each city in your dataset, separated into different groups based on the city attribute.

FACET CASES
The other variant of facet is facet cases . Using the keyword cases along with Facet we can add multiple conditions to out query or even combine multiple attributes within each FACET CASE.
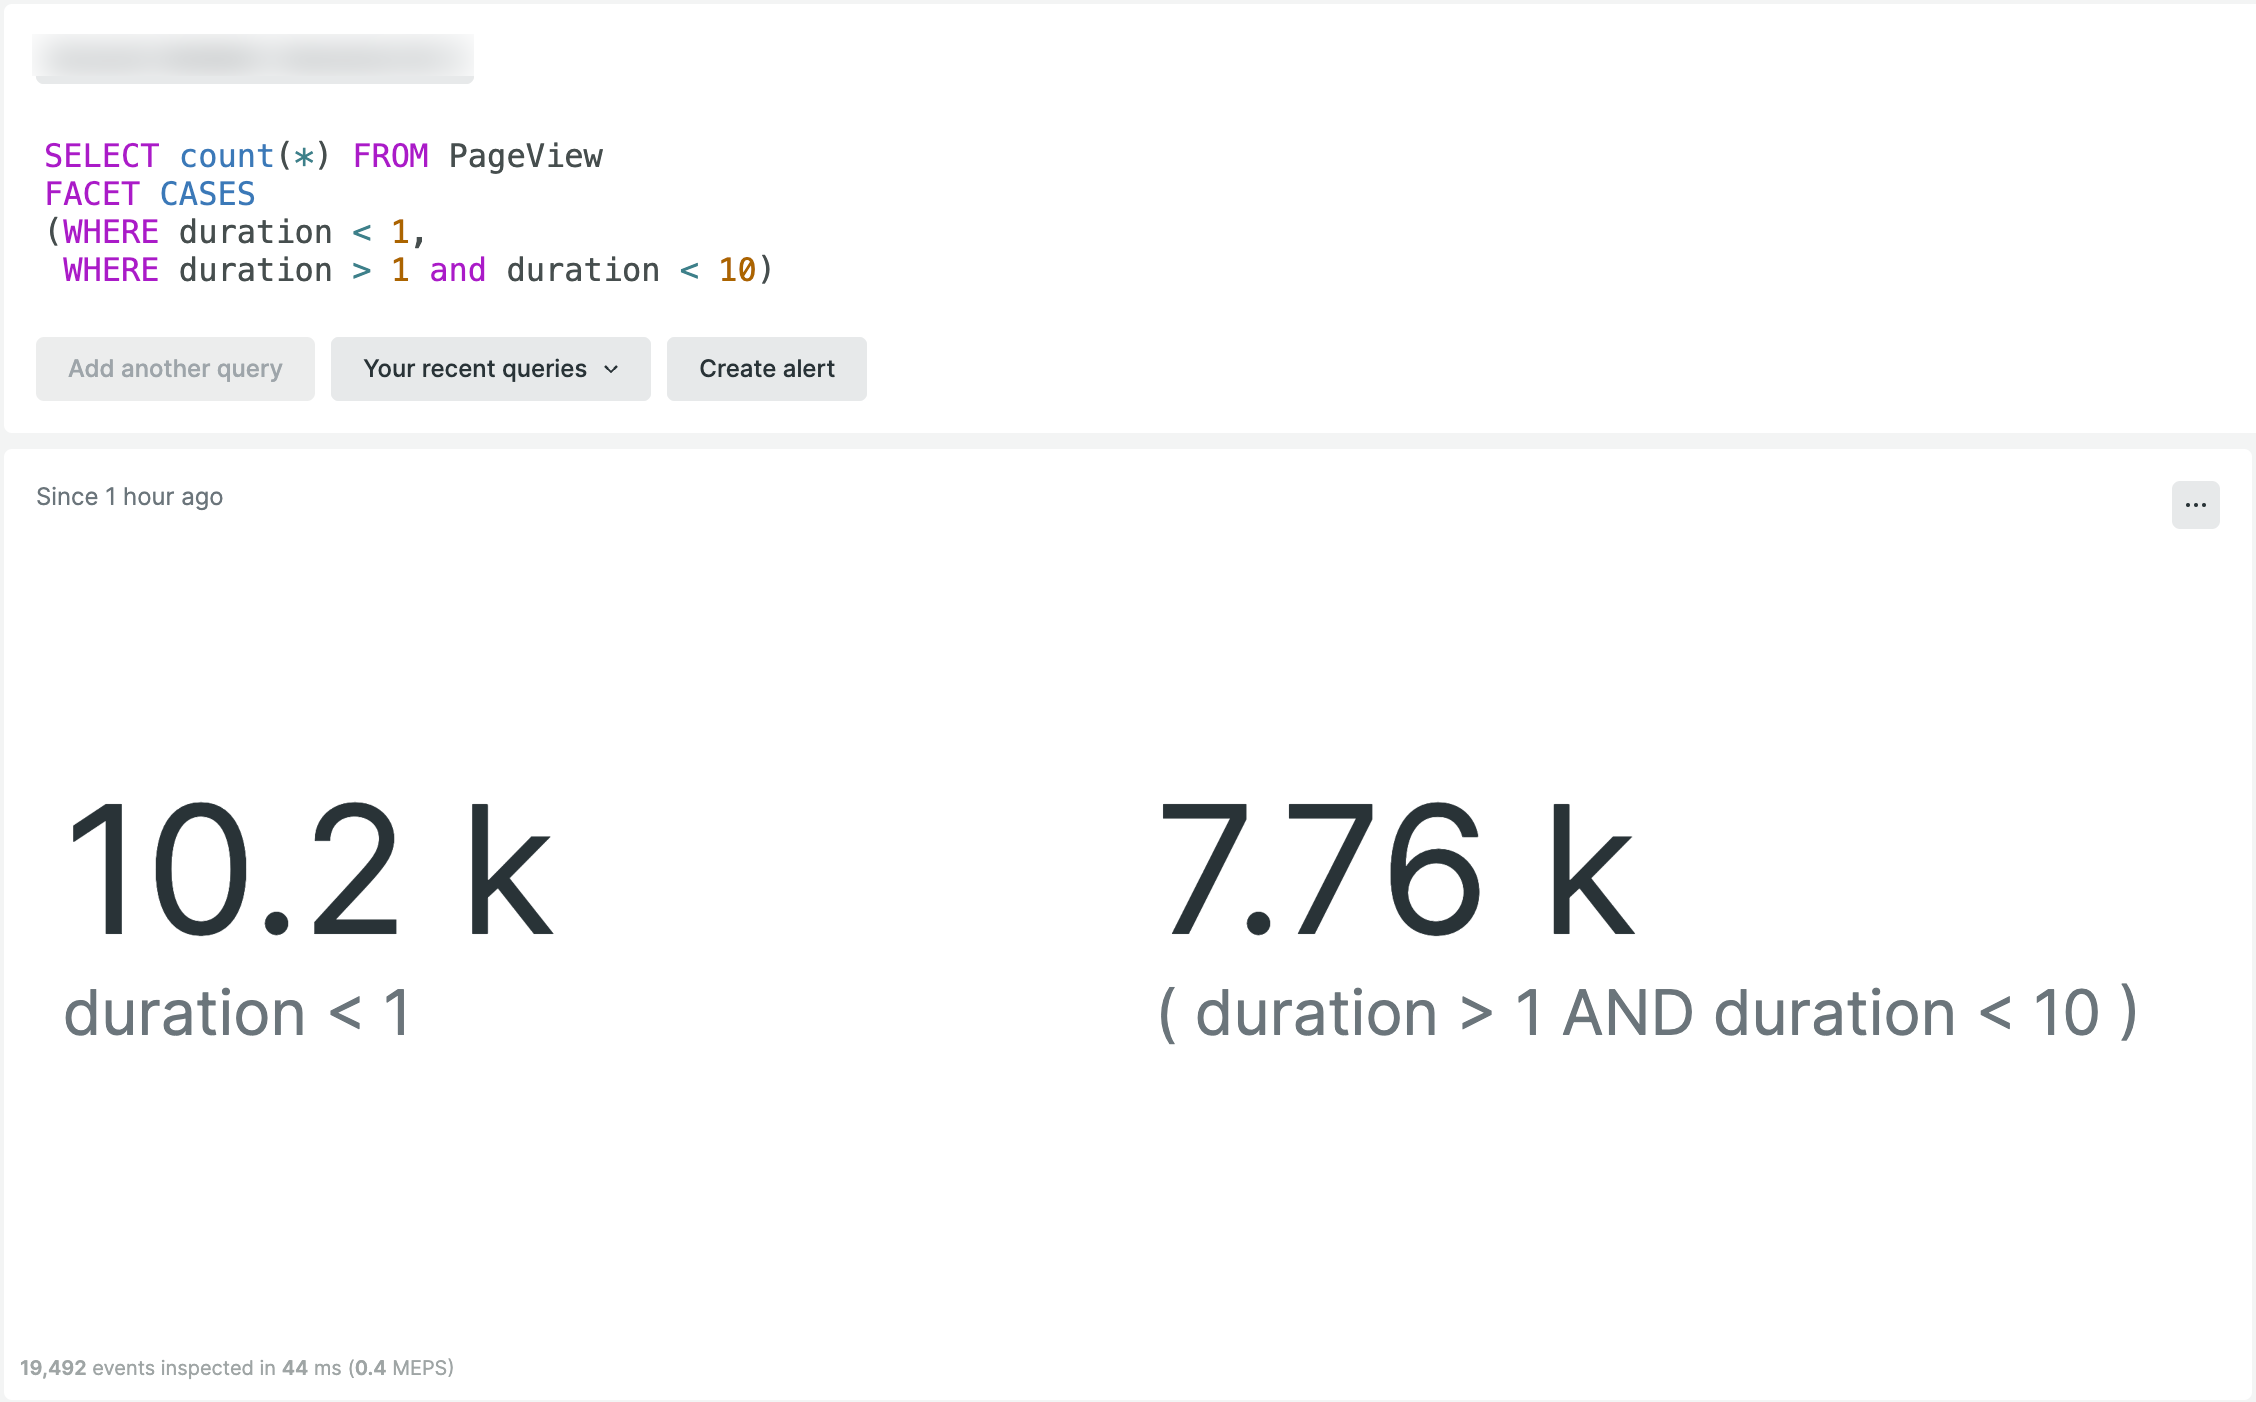
Here's an example where you can use the FACET CASES clause to query PageView data and retrieve multiple results between different duration values from the dataset:
SELECT count(*) FROM PageView
FACET CASES
(WHERE duration < 1,
 WHERE duration > 1 and duration < 10)
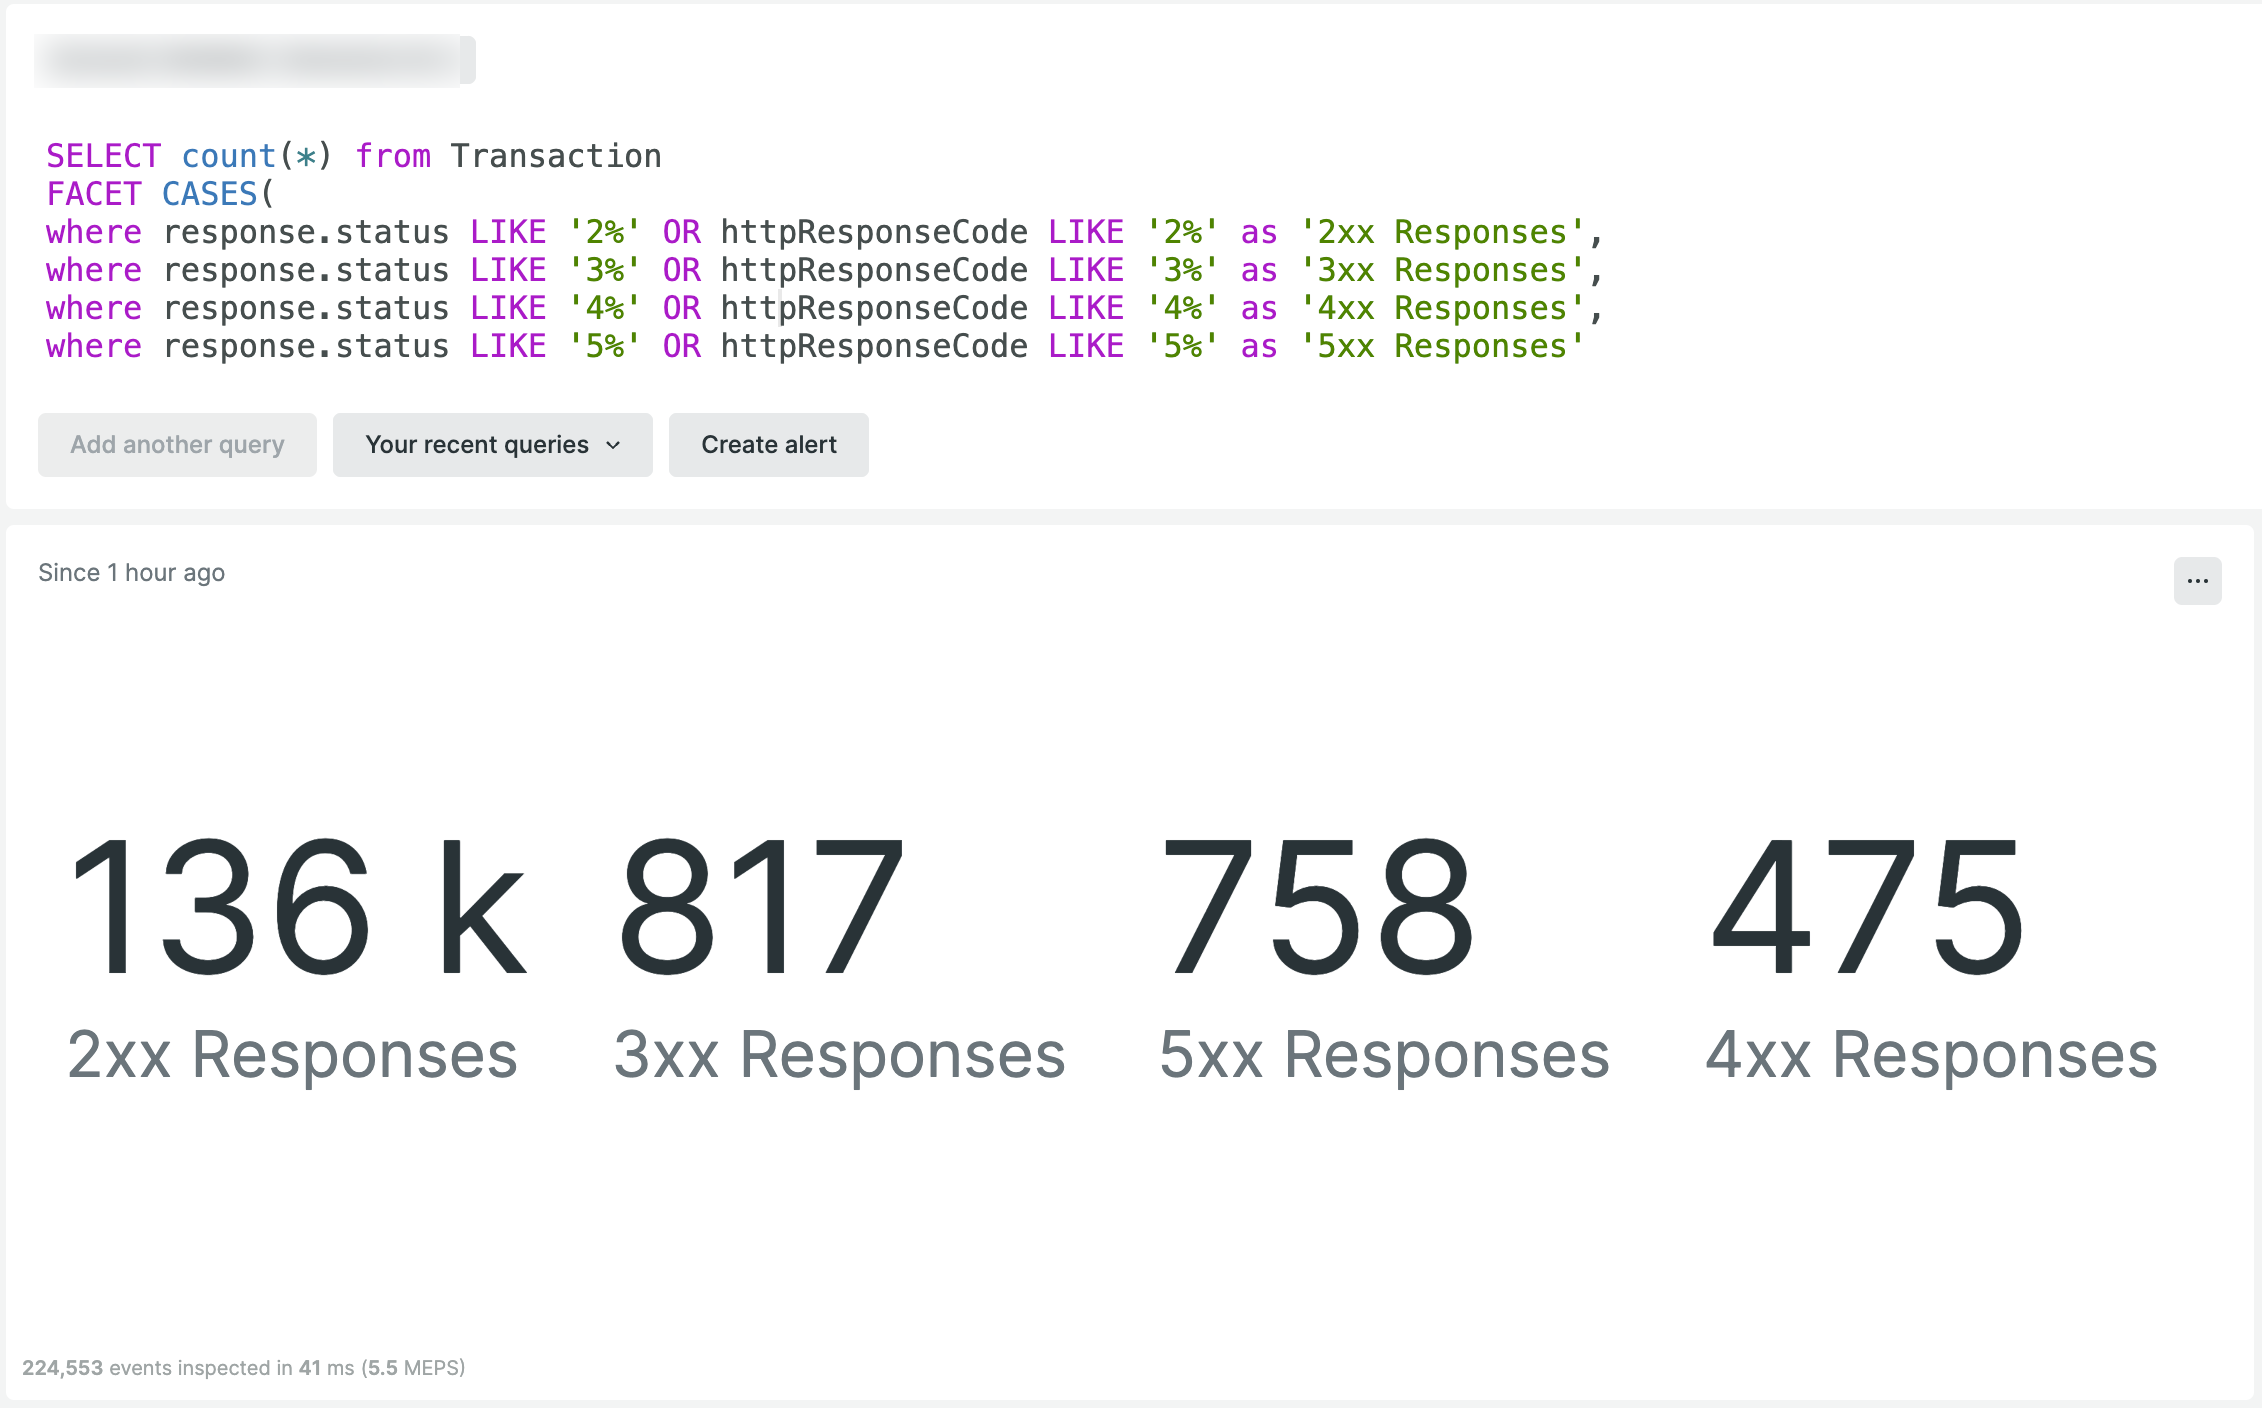
To make your query results more readable and easily understandable, you can assign custom labels to each of the conditions within the FACET CASES by using the as option for labelling:
SELECT count(*) from Transaction
FACET CASES(
where response.status LIKE '2%' OR httpResponseCode LIKE '2%' as '2xx Responses',
where response.status LIKE '3%' OR httpResponseCode LIKE '3%' as '3xx Responses',
where response.status LIKE '4%' OR httpResponseCode LIKE '4%' as '4xx Responses',
where response.status LIKE '5%' OR httpResponseCode LIKE '5%' as '5xx Responses'
)
References
Number 5: Filter
Filtering your query results can be a useful way to narrow down the results to only the most relevant information. NRQL provides a variety of methods to filter your datasets.
Wildcard filter
Wildcard filters are helpful when trying to filter the result of a query with a certain pattern on selected dataset properties. NRQL provides a good mechanism to add wildcard filters by using the % symbol.
In the sample below, we're taking an average of all the properties that end with .duration in our dataset. In the results, we see two properties matching our filter:
FROM Metric SELECT average(%.duration) FACET metricName TIMESERIES

filter() function
The filter() function is helpful in cases where we need to query and combine results from multiple attributes. We can simply combine multiple dataset results with filter() , separated by comma in our query.
In this example we're using an aggregator to get total count of all the events in our dataset labelled as “Combined events” from the attribute PageView and Transaction.
SELECT COUNT(*) AS 'Combined Events' FROM Transaction, PageView SINCE 1 DAY AGO
_1.png "NRQL filter() sample")
We can make the output to be more interesting by showing the total of all events, as well as individual total counts of PageView and Transaction events. This can be easily achieved by using the filter() function with the following query:
SELECT count(*) as 'Combined Events',
filter(count(*), WHERE eventType() = 'PageView') as 'Page Views',
filter(count(*), WHERE eventType()='Transaction') as 'Transactions'
FROM Transaction, PageView SINCE  1 DAY AGO
_2.png)
Here's another example where we can use filter() to get the count of different metrics with the WHERE clause from all the Transaction:
FROM Transaction SELECT
filter(count(*), where request.uri not like '/api/%') as 'Others',
filter(count(*), where request.uri like '/api/tutorials%') as 'Tutorial Endpoints',
filter(count(*), where request.uri like '/api/weather%') as 'Weather Endpoints'
where appName = 'node-express-mongodb'
since 2 months ago limit max
_3.png "NRQL WHERE clause with filter()")
References
- Read more on FILTER()
So far in this part of the blog, we've covered the basic NRQL functions necessary to query data. In the next part, we'll cover slightly more advanced functions and features of NRQL. These will help you tackle complex data querying and visualizations, enabling you to make the most of your telemetry data.
Next steps
If you're not already using New Relic, sign up for a free account to test out all of our features. Your free account includes 100 GB/month of free data ingest, one free full-access user, and unlimited free basic users.
Watch for the next part of this blog series for more NRQL functions, and best practices.

The views expressed on this blog are those of the author and do not necessarily reflect the views of New Relic. Any solutions offered by the author are environment-specific and not part of the commercial solutions or support offered by New Relic. Please join us exclusively at the Explorers Hub (support.newrelic.com) for questions and support related to this blog post. This blog may contain links to content on third-party sites. By providing such links, New Relic does not adopt, guarantee, approve or endorse the information, views or products available on such sites.


