Modern applications don’t fail quietly. They scream in dashboards, logs, and alerts and sometimes all at once. But when every small fluctuation produces a notification, the real problem isn’t silence, it’s noise. And that noise often slows teams down at the very moment they need clarity.
This is where alert fatigue sets in. DevOps and SRE teams working with cloud workloads, microservices, and rapid deployments see hundreds of alerts triggered every day. Many are duplicates, some are irrelevant, and only a handful actually point to issues that demand attention. Result? When every alert screams ‘critical’, nothing feels urgent. Engineers spend hours triaging false positives, and important signals risk being buried. That delay directly increases mean time to resolution (MTTR), which ultimately means frustrated customers and financial loss for the business.
The underlying issue is that traditional, threshold-based alerting wasn’t designed for such dynamic environments. Static rules break when baselines shift constantly. To keep pace, teams need intelligent alerting that uses AI to cut through the noise, detect anomalies in real time, and surface what truly matters.
In this blog, we’ll explore what intelligent alerting means in practice, how New Relic applies AI to reduce noise and detect anomalies, and how you can set it up in your own environment.
What is Intelligent Alerting?
At its core, intelligent alerting is about moving beyond static rules and thresholds. Traditional alerting systems work by flagging any metric that crosses a fixed threshold, such as CPU usage above 80% or response time exceeding two seconds. While simple, this approach doesn’t account for the dynamic nature of today’s systems. What looks like a spike one moment may be just routine load the next.
Intelligent alerting introduces AI and Machine Learning into the process. Instead of relying solely on predefined thresholds, it learns the natural behavior of your systems over time. It adapts to patterns, seasonality, and workload changes, so that alerts trigger only when something truly unusual occurs. The key advantage is context. Intelligent alerting doesn’t just tell you that “something is wrong”, it helps distinguish between expected fluctuations and genuine anomalies. This means fewer false positives, less noise, and faster identification of issues that could actually impact customers or business operations. In short, intelligent alerting is a smarter, adaptive approach that lets teams focus on real problems instead of chasing every blip on the dashboard.
Under the Hood: How New Relic AIOps Transforms Alerting
If intelligent alerting is the what, then AIOps is the how. AIOps, short for artificial intelligence for IT operations, is the layer of intelligence inside New Relic that makes alerts smarter. It takes the principles of adaptive, context-aware alerting and embeds them into the way telemetry signals are monitored, correlated, and routed.
Instead of relying on static thresholds or one-off conditions, New Relic AIOps applies algorithms that continuously learn from your environment. It looks at patterns across metrics, traces, and logs, and decides whether an event is noise, an anomaly, or part of a bigger issue that deserves attention. Here’s how it works in practice:
- Conditions and policies (the core)
Users define alert conditions on telemetry signals, either fixed thresholds or anomaly rules, and group them into policies. These definitions specify when incidents should be generated. - Anomaly detection (dynamic baselines)
Incidents can be triggered by dynamic baselines that account for seasonality and workload patterns, raising alerts only when behavior is truly unusual. - Incidents and correlation
When an alert condition is met (static or dynamic), an incident is generated. AIOps then applies correlation logic (built-in or custom) based on time, entity relationships, and metadata to group related incidents into a single issue. This reduces noise and helps teams focus on the actual problem rather than a flood of isolated alerts. - Predictive alerts
Predictive alerting uses historical data to forecast near-term values and raise alerts before a threshold breach is likely. This capability is now generally available in the platform. - Workflows and notifications
Users configure workflows to control how issues are routed i.e., Slack, PagerDuty, ServiceNow, or other destinations. AIOps executes this routing and attaches relevant context, such as impacted entities or tags, to support investigation.
In short, AIOps provides the structure for how alerts are created, correlated, and routed. But the precision of this system depends on how incidents are first generated. Since most incidents originate from conditions that track unusual behavior, the way baselines and thresholds are tuned directly determines how accurate and useful alerts will be.
Anomaly detection
Anomaly detection in New Relic AIOps predicts expected values from historical telemetry and flags incidents when live data deviates significantly. This approach gives far more flexibility and reduces noise from normal fluctuations, but it also requires careful tuning to avoid false positives.
New Relic provides several parameters for fine-tuning anomaly detection:
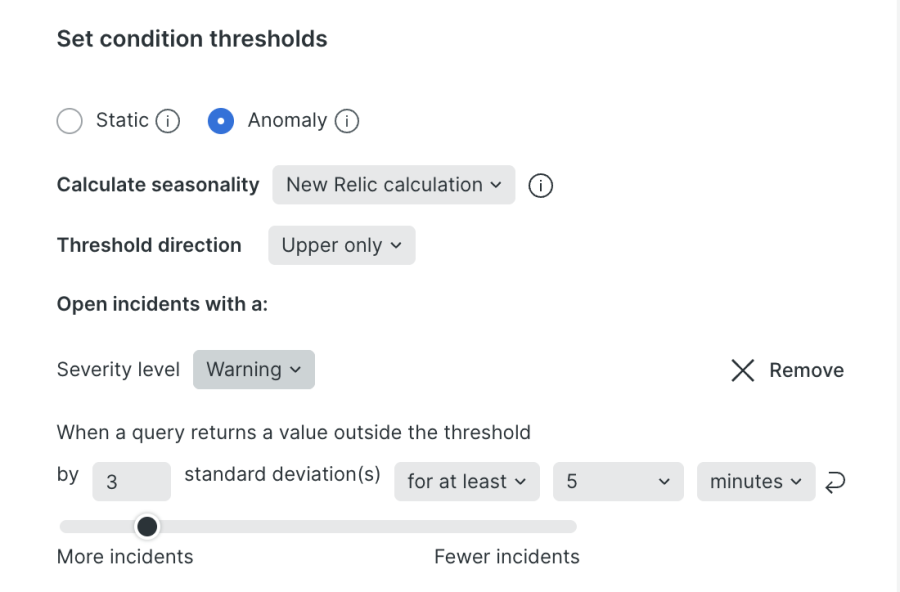
- Sensitivity (standard deviation threshold): Sensitivity defines how far data must drift from the predicted baseline before an incident is triggered. A narrow band (e.g., 1.5σ) captures small deviations quickly but risks noise, while a wider band (e.g., 3σ) reduces false positives but may delay detection.
- Seasonality: By default, AIOps detects recurring cycles automatically, such as weekday traffic peaks or nightly batch jobs. However, users can override this behavior and set fixed seasonality (hourly, daily, or weekly), or disable it entirely. This prevents predictable patterns from generating unnecessary incidents.
- Directionality: Users specify whether to alert on increases only, decreases only, or both directions. For example, latency is typically monitored with an upper-bound rule, while throughput might use a lower-bound rule to catch unexpected drops.
- Threshold duration and evaluation mode: Incidents open only if deviations persist for a defined time window. Teams can require every data point in the window to breach (at least) or allow a single breach (at least once in).
- Multi-signal conditions: With NRQL queries that use FACET, anomaly detection can monitor up to 5,000 signals under one condition. Each signal is evaluated independently, but the same threshold rules apply consistently across them.
For example, a service handling burst traffic during campaigns can be tuned to 3σ, upper-only, and at least mode, as shown in the following example. This prevents false positives from short-lived spikes while still catching sustained anomalies.

Even with fine-tuning, downstream dependencies can still generate multiple incidents for a single failure, creating noise. This is where correlation takes over.
Alert correlation
Even with anomaly detection tuned carefully, complex systems can still generate a high volume of valid incidents. To prevent teams from being overloaded, New Relic AIOps applies correlation to combine related incidents into actionable issues.
In practice, Correlation works through a few core strategies:
- Time proximity: Incidents raised within the same time window are grouped, preventing bursts of related alerts from being reported separately.
- Entity and metadata analysis: Each incident carries metadata such as service name, environment, or deployment markers. Correlation logic links incidents that share these attributes. For instance, if a caching layer fails, dozens of downstream services may throw latency or error alerts. Instead of opening separate incidents for each, AIOps groups them into a single cache-related issue.
- Decisions framework: Correlation is controlled through decisions. New Relic provides built-in decisions for common cases, and teams can define custom ones to match their architecture. For example, incidents from a group of microservices can always be treated as one issue if they fail together.
- Normalization and suppression: Duplicate or near-duplicate incidents are collapsed automatically, reducing noise from overlapping monitors or tools.
These strategies let teams manage incidents at the issue level rather than sifting through dozens of related alerts. You can learn to configure correlation logic with decisions in our documentation or refer to our blogs for seeking root cause and reducing noise with alert correlation.
Predictive Alerting
Predictive alerting extends intelligent alerting by shifting from detection to anticipation. Instead of firing when data crosses a line, New Relic applies forecasting to telemetry signals and raises incidents when values are projected to breach a threshold within the look-ahead window. The following image shows the predictive alert setup in New Relic.
The feature uses the Holt-Winters algorithm (exponential smoothing), which automatically selects seasonal or non-seasonal models depending on the data. Seasonal models handle repeating cycles such as daily traffic spikes or weekly workload patterns, provided there is at least three cycles of history. Non-seasonal models capture trend and level when no repeating pattern exists. Up to 360 future data points can be projected, with the look-ahead duration defined in the alert condition.
This approach has two major benefits for noise reduction:
- Anticipating real risks: Forecasting metrics like CPU utilization or throughput provides early warning before limits are exceeded, giving teams time to respond.
- Suppressing false positives during expected peaks: By learning seasonal behavior, predictive alerting avoids triggering during known bursts, such as daily traffic surges, while still surfacing anomalies that break the pattern.
For example, a streaming service may see consistent evening traffic growth. Static thresholds or even anomaly detection might fire every night. With predictive alerting, the system recognizes the pattern and only generates an alert if traffic is projected to exceed safe capacity.
By combining forecasting with anomaly detection and correlation, predictive alerting ensures alerts are accurate, contextual, and proactive, giving teams confidence that the incidents they see are both meaningful and actionable. Learn to enable and set up predictive alerts in our documentation.
Measuring Impact: Quantifying noise reduction and alert precision
The value of intelligent alerting is not just in how it works, but in the outcomes it delivers. Every team has alerting policies in place, but without measurement it’s hard to know if those policies are reducing noise or simply adding another layer of alerts. Measuring the impact of anomaly detection, correlation, and predictive alerts helps answer critical questions:
- Are we receiving fewer, more meaningful alerts?
- Are incidents being resolved faster because engineers see the right context?
- Is noise truly decreasing, or just shifting into different channels?
New Relic provides the telemetry needed to quantify these outcomes. Using incident and issue data, teams can track:
- Incident volume and priority mix
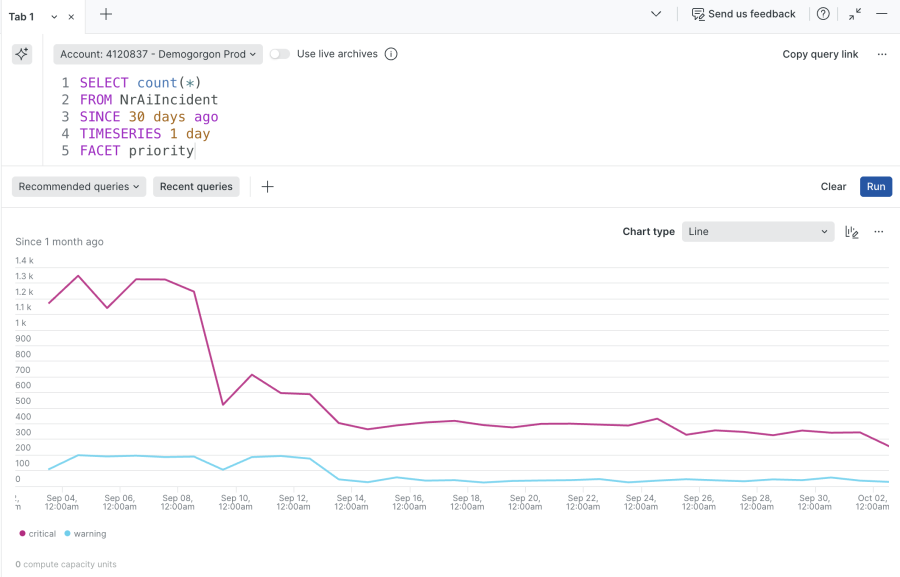
A simple but powerful signal is whether overall incidents are trending down, and whether the mix of severities is becoming healthier e.g., shifting toward fewer high-severity incidents. You can visualize this with NRQL:
SELECT count(*)
FROM NrAiIncident
SINCE 30 days ago
TIMESERIES 1 day
FACET priority
- Incident duration (proxy for MTTR)
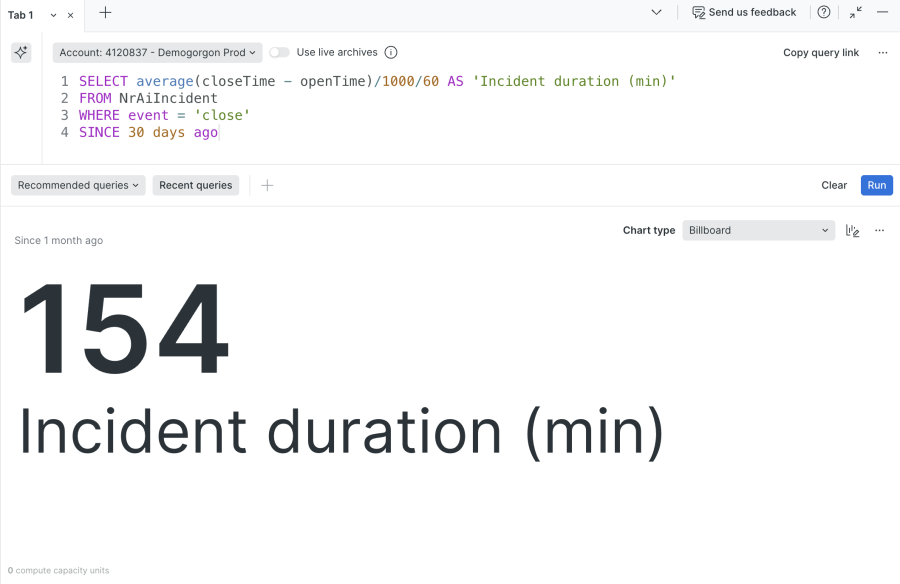
Shorter time-to-resolution suggests that alerts are clearer and better correlated. This can be measured directly from incident open and close times:
SELECT average(closeTime - openTime)/1000/60 AS 'Incident duration (min)'
FROM NrAiIncident
WHERE event = 'close'
SINCE 30 days ago
- Issue-level insights
Beyond raw incident metrics, New Relic’s Issues feed shows how alerts are being correlated and prioritized. Each issue provides:- A timeline of correlated incidents.
- A map of impacted entities and their relationships.
- Priority automatically derived from the highest-severity incident.
- Filtering options by tags, correlation state, or priority to spot noise patterns.
- Postmortem reports that gather events, metrics, and metadata once an issue is resolved.
Many teams build NRQL dashboards for incident trends and rely on the Issues feed for correlated views, giving them both raw and high-level perspectives. For more guidance, see Issues and incident management and response docs.
Closing thoughts
Static thresholds and one-off conditions no longer match the complexity of modern systems. Intelligent alerting in New Relic, powered by anomaly detection, correlation, and predictive analytics, shifts the focus from chasing noisy alerts to acting on the signals that matter.
With anomaly detection, teams get precise alerts tuned to their environment. With correlation, they cut through cascades of duplicate incidents and focus on root causes. With predictive alerting, they anticipate problems before they happen. And by measuring impact through incident trends and issue insights, they can prove the value of their alerting strategy over time.
The result is not just fewer alerts, but better ones: context-rich, accurate, and actionable. That’s how intelligent alerting helps engineering teams stay ahead of problems and keep systems reliable at scale.
Next steps
Ready to see how intelligent alerting can cut through the noise in your environment? Sign up for a free account and get started with New Relic alerts to put anomaly detection, correlation, and predictive alerting into action.
The views expressed on this blog are those of the author and do not necessarily reflect the views of New Relic. Any solutions offered by the author are environment-specific and not part of the commercial solutions or support offered by New Relic. Please join us exclusively at the Explorers Hub (discuss.newrelic.com) for questions and support related to this blog post. This blog may contain links to content on third-party sites. By providing such links, New Relic does not adopt, guarantee, approve or endorse the information, views or products available on such sites.


