You’re just sitting down to dinner when you receive an alert: your billing service has an error percentage of >25% for longer than five minutes, violating the threshold. Now what?
Unearthing the root cause of an alert violation can be difficult and time-consuming.
When an alert violation is triggered, it means the conditions in the monitored entity have crossed the thresholds you’ve defined, but that doesn’t tell you why it was crossed. Alert violations should surface structured, organized data about your system’s state and give you the context and details you need, so you know what direction to start digging.
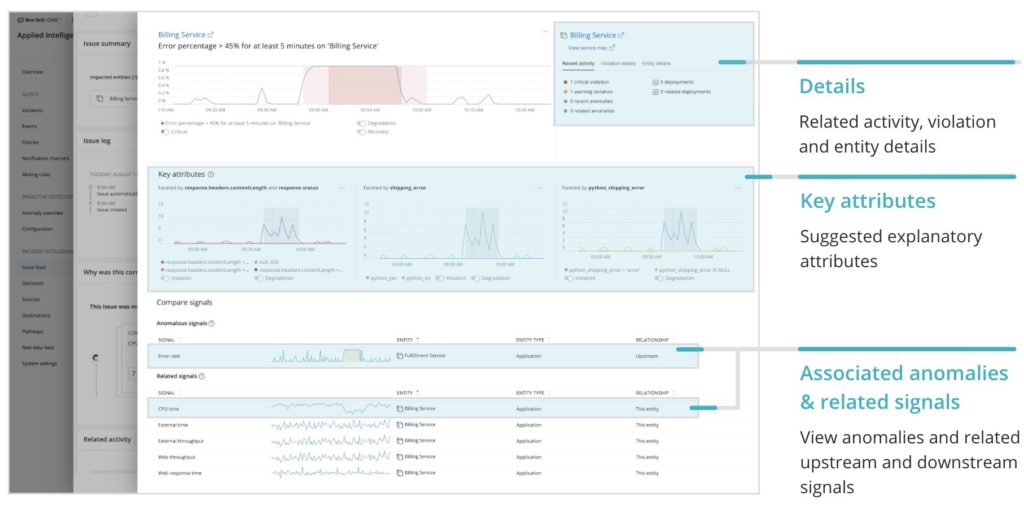
If you’ve configured Incident Intelligence, within New Relic Applied Intelligence, you are already receiving fewer, more meaningful alerts. You can now dig deeper into the alert you just received with automatic alert analysis that provides context and explanation about each alert violation. You also get a structured view and additional information about the entity and what was happening around it when the threshold was crossed to help you troubleshoot even faster. Alert analysis includes:
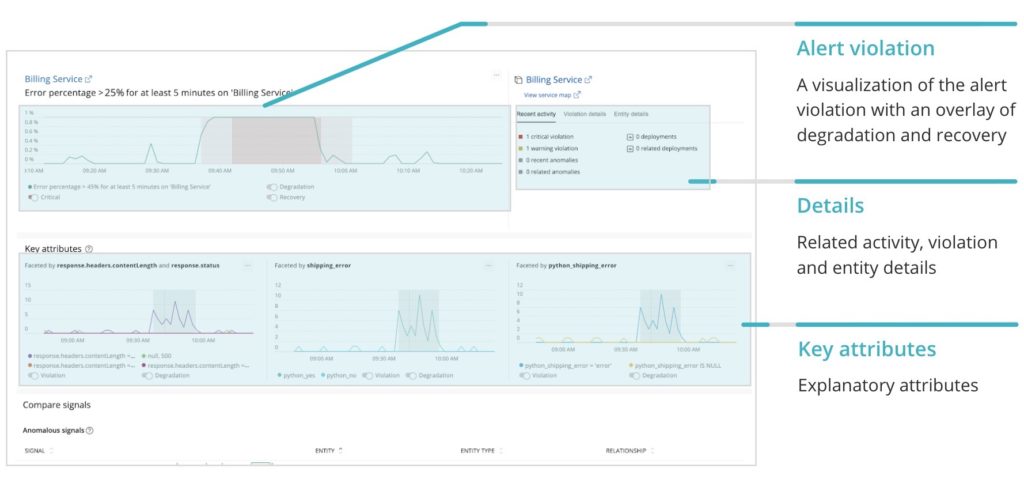
- A chart of the violation
- Details about recent activity, the violation, and the entity
- A suggestion of key attributes that may explain the alert
- A comparison of signals showing associated anomalies (if you’ve configured Proactive Detection) and related signals for this specific entity—such as CPU, throughput, and more—that occurred around the same time as the alert violation
Viewing an alert analysis
To get started, you’ll need to configure Incident Intelligence within New Relic Applied Intelligence. Alert analysis integrates with Proactive Detection and Incident Intelligence, so if you want additional context—such as related anomalies—you’ll want to configure Proactive Detection.
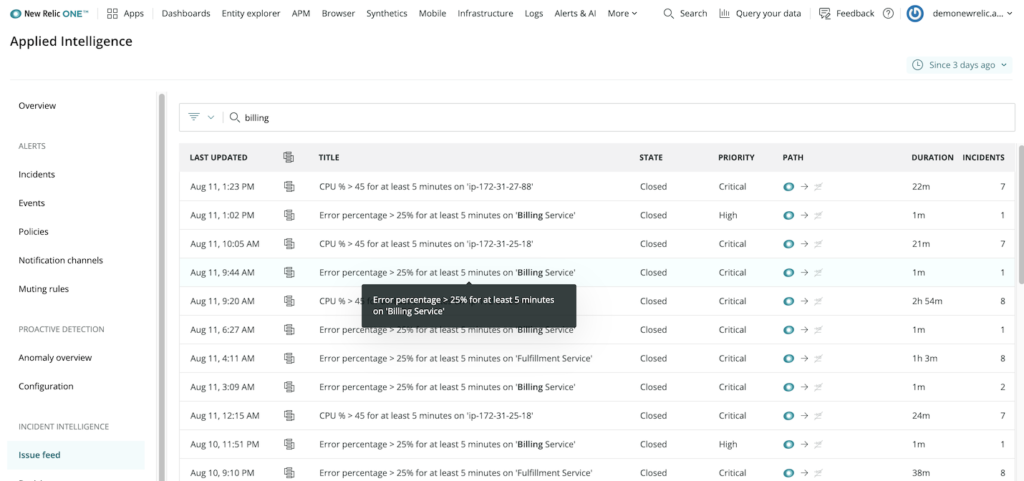
In this case, you want to dig deeper into the alert violation from the introduction: the billing service has violated the static alert threshold with an error percentage of >25% for at least five minutes. To view the alert analysis, navigate to Alerts & AI > Incident Intelligence > Issue Feed.

When you open the issue, you’ll find Related Activity; to dig into a detailed analysis of the alert, click Analyze.
If you’re familiar with the Proactive Detection analyze anomaly page, this will look very familiar, as its information is structured in the same layout. In the upper left, you’ll see a chart of the alert violation.
Additional details about related activity, the violation, and the entity violated can be found in the upper right.
The second row surfaces explanatory key attributes that may be related to the alert. In this case, using our demo environment, we periodically script errors into the code, which you can see surfaced here.
The Compare signals section displays related anomalies, powered by Proactive Detection, that occurred around the same time as the alert. In the case of our example, an upstream anomaly related to the fulfillment service occurred at the same time as our alert violation.
You can see additional related signals for this specific entity, such as CPU time, throughput, and web response, that give you additional context. Using the sparklines next to the signals, you can quickly compare and contrast everything that has happened over a period time across multiple signals and assess what to troubleshoot next; for example, do you need to dive deeper into an external service, the entity itself, or the query you based your threshold on?
By equipping you with context, details, and structured information about alerts, New Relic Applied Intelligence helps you troubleshoot faster, and keeps you from aimlessly digging through mounds of data as you search for answers.
To get started with Applied Intelligence, sign up for a free New Relic account.
The views expressed on this blog are those of the author and do not necessarily reflect the views of New Relic. Any solutions offered by the author are environment-specific and not part of the commercial solutions or support offered by New Relic. Please join us exclusively at the Explorers Hub (discuss.newrelic.com) for questions and support related to this blog post. This blog may contain links to content on third-party sites. By providing such links, New Relic does not adopt, guarantee, approve or endorse the information, views or products available on such sites.


