The New Relic platform provides a wide variety of robust views, tools, and analytical insights designed to help customers better understand the performance of their software—and their business.
To that end, we want to help our customers discover the many ways they can improve their business with New Relic. That’s why New Relic University has created a series of online webinars dedicated to helping customers make the most of the platform, from getting started with specific New Relic products to configuration tips and tricks.
In this post, you can watch an on-demand example of an NRU webinar, link to a list of the complete series, and find out about upcoming live interactive webinar where you can get your own questions answered in real time.
Getting started with New Relic APM
Suppose you receive an alert informing you that an app you’re monitoring is experiencing some performance problems. Or suppose that a customer calls your support line complaining that your application is sluggish.
What do you tell that customer?
How do you know whether the app is really sluggish? Is there truly a problem with your app, or is there something wrong on the client side? Perhaps it’s a problem with your customer’s environment, with the web browser they’re using, the mobile device they’re connecting from, or the network in between your client and your app? Maybe the underlying infrastructure is experiencing problems that are affecting your app. Or, perhaps, some external service that your app is using has performance issues of its own. How do you know for sure which it is? And how do you use that information to improve the performance of your application?
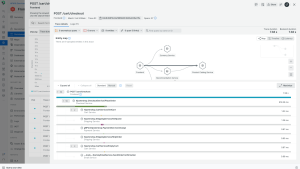
In this 25-minute video, Phil Weber from New Relic University shows you how to use New Relic APM to identify performance issues and perform a root-cause analysis. Using tools such as transaction traces, error analytics, and database query call stacks, Phil shows how you can assert with confidence where the cause of a performance problem lies, and obtain actionable insights on how to fix the issue.
Attend a live, interactive New Relic training webinar
We invite you to join us at our upcoming interactive webinars—led by New Relic University—to learn more about how to use the New Relic platform. These 90-minute interactive sessions focus on how New Relic helps DevOps teams monitor, troubleshoot, and optimize their digital platforms, improving their operational efficiency.
Monitoring and Troubleshooting Applications with New Relic
This developer-focused webinar will focus on developer skills such as troubleshooting performance problems, configuring data collection, and using the thread profiler. We’ll also explore how to combine multiple New Relic products to solve customer experience problems and how to use APIs to get data into and out of New Relic.
Ops with New Relic
Are you responsible for the management, monitoring, and operation of a production application? This webinar will focus on the Operations role. We’ll dive into application deployments, alerting, and infrastructure monitoring, both in the cloud and on-premise. Learn how to use service maps to quickly evaluate complex applications, create alert policies that don’t overwhelm your inbox, monitor your servers using New Relic Infrastructure, troubleshoot performance problems, and use New Relic Insights to explore data in detail.
Fundamentals of New Relic Insights
New Relic Insights is our real-time, cloud-based analytics platform that collects, stores, and transforms data into actionable information about your customers, applications, and business. In this webinar, you’ll learn how to use the data explorer, ask questions with New Relic Query Language (NRQL), create dashboards, use the Insights API, and more.
For the latest information on New Relic University events, and to register for these free webinars, visit: https://learn.newrelic.com/
The views expressed on this blog are those of the author and do not necessarily reflect the views of New Relic. Any solutions offered by the author are environment-specific and not part of the commercial solutions or support offered by New Relic. Please join us exclusively at the Explorers Hub (discuss.newrelic.com) for questions and support related to this blog post. This blog may contain links to content on third-party sites. By providing such links, New Relic does not adopt, guarantee, approve or endorse the information, views or products available on such sites.


