Container technology—popularized by Docker and Kubernetes—has profoundly changed the way many development and operations teams test and deploy their applications. Containers help companies modernize by making it easier to scale and deploy applications while creating a positive impact on IT costs. However, this also introduces new challenges and more complexity as containers and container orchestration create an entirely new infrastructure ecosystem. Running containerized environments requires teams to rethink and adapt their monitoring strategies to take into account all of the new layers introduced in this ecosystem.
The DevOps customer conundrum
At the end of the day, DevOps teams are charged with delivering high-quality software that delivers a great customer experience unaffected by any changes to your platforms, tools, languages, or frameworks. Customers don’t care if you’re using traditional virtual machines, a bleeding-edge multi-cloud federated Kubernetes cluster, or a home-grown artisanal orchestration layer—they just want the applications and services you provide to be reliable, available, and fast. Tools like Docker and Kubernetes are useful only insofar as they make that possible.
You need a method that is optimized for monitoring applications even in containerized environments.
Why you need this guide…
Our blog post on Monitoring Application Performance in Kubernetes offers an application-centric approach to APM in a containerized environment. But since you need visibility into every layer of your environment, this post extends that understanding to monitoring your complete Docker/Kubernetes infrastructure.
There are some things we recommend you start out with when monitoring Docker containers. The first is a quality container monitoring tool, New Relic’s infrastructure monitoring tool is a perfect candidate. Let's cover some basics first.
What is Docker container monitoring?
Docker container monitoring refers to tracking and managing the performance, health, and resource utilization of Docker containers. Docker is a popular platform for containerization, which allows developers to package and deploy applications and their dependencies in a consistent and isolated environment.
Key aspects of Docker container monitoring include resource utilization monitoring, health checks, network monitoring, logging and logging analysis, orchestration system integration, security monitoring, and custom metrics and alerts.
Why is Docker container monitoring important?
Docker container monitoring is essential for optimizing resource utilization, enhancing performance, and ensuring the reliability of containerized applications. Tracking metrics such as CPU, memory, and storage usage, monitoring tools enable teams to proactively detect issues, set up alerts for abnormal behavior, and troubleshoot problems in real time.
This proactive approach not only minimizes downtime but also allows for efficient scalability, elasticity, and capacity planning based on historical data and usage patterns. Additionally, it facilitates continuous improvement by offering valuable insights for data-driven decision-making and optimization efforts.
Docker monitoring tools
In order to fully understand what’s going on in your environment, you need to see into all of the layers in your dynamic environment, including inside your containers. An ideal container monitoring tool does just that. A great tool is That means holistic, with application-centric and infrastructure-centric monitoring. There are various Docker monitoring tools available, each designed to address specific aspects of containerized environments. Here are some types of Docker monitoring tools:
Container-level monitoring:
- cAdvisor (Container Advisor): cAdvisor provides detailed information about resource usage (CPU, memory, disk, and network) for running containers. It's lightweight and integrates seamlessly with Docker.
Orchestration platform integration:
- Prometheus: Often used with Kubernetes, Prometheus is a powerful monitoring and alerting tool that collects and stores time-series data. It can be integrated with Docker for comprehensive container monitoring.
- Grafana: While not a monitoring tool itself, Grafana is often paired with Prometheus or other data sources to visualize and analyze monitoring data in real time.
Full-stack monitoring:
- New Relic: New Relic provides comprehensive monitoring and analytics for applications, including Docker containers. It offers detailed performance metrics, traces, and logs, enabling end-to-end visibility.
Log management:
- ELK Stack (Elasticsearch, Logstash, Kibana): Elasticsearch, Logstash, and Kibana together create the ELK Stack, which is commonly used for centralized logging and log analysis in Docker environments.
- Fluentd: Fluentd is an open-source data collector that can be used for log forwarding and aggregation in Docker.
Infrastructure monitoring:
- Sysdig: Sysdig offers container visibility and security solutions. It provides real-time monitoring, troubleshooting, and security features for Docker environments.
- New Relic: New Relic offers a real-time monitoring solution designed to provide comprehensive insights into the performance and health of your IT infrastructure. It enables you to track and analyze critical data from your servers, containers, cloud services, and applications in one unified platform.
Security monitoring:
- Aqua security: Focused on container security, Aqua Security monitors container activities, enforces security policies, and helps identify and prevent security threats in Dockerized environments.
- Twistlock (Now Prisma Cloud): Similar to Aqua Security, Twistlock (now part of Palo Alto Networks Prisma Cloud) provides security and compliance solutions for containerized applications.
Networking monitoring:
- Weave Scope: Weave Scope offers visualizations of containerized applications, helping in understanding network connections and dependencies between containers.
Custom metrics and events:
Telegraf: Telegraf is a plugin-driven server agent that can collect and send custom metrics and events from various sources, making it versatile for Docker monitoring.
When you’re looking into tools to use, we recommend making sure your tool has at least all of the following:
Extensive coverage
- Coverage of metrics, log formats, and events
Strategic correlation of metrics
- Events
- Logs
- Traces
- Addt. metrics
Detection of new containers
New Relic has all of these capabilities and more. The rest of our article shows you how to use New Relic’s extensive monitoring platform to measure and improve your container performance.
You could likely use a similar process across other tools but may not find many of the custom options and additional strategic metric correlation opportunities we’ve listed in our guide.
Docker container monitoring with New Relic
New Relic Infrastructure automatically collects metrics for Docker containers running on hosts that have the agent installed on them. Once you deploy the Infrastructure agent, New Relic can automatically monitor the processes running inside containers on a host. The Infrastructure agent automatically imports all the labels associated with the containers and allows you to filter and group by the metadata associated with those labels.
But that’s just the start of what you can do. New Relic Infrastructure lets you filter down to see all the processes running inside a container using the “contained” attribute. From there, you can click on “Filter Processes” and “contained” and then select “true” to see all the processes running on your containers, as shown here:
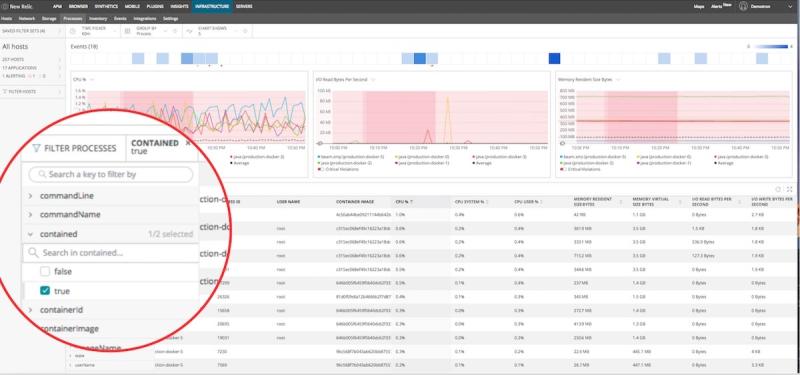
monitor docker and kubernetes new relic dashboard
Additionally, you can see which container is running what process in order to pinpoint the CPU, memory, and I/O used by that process within the container. Since container image is a unique key to differentiate between containers. you can also group apps by container image to see all the processes running within a specific container. The annotated screenshot below is a cheat sheet for the navigation in New Relic Infrastructure:
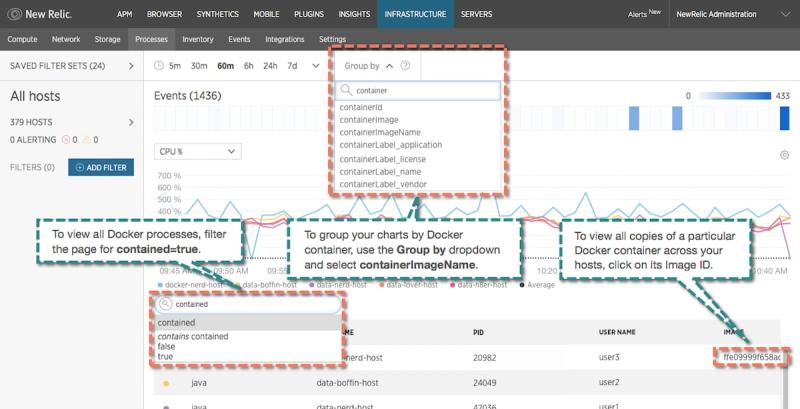
monitor docker and kubernetes new relic dashboard
How to monitor containers in Kubernetes with New Relic
Remember that containers can move between hosts when they’re redeployed. As noted earlier, in an environment using orchestration tools like Kubernetes, your containers will often do just that. They’ll be on one host during one deploy and then they’ll move to a different set of hosts during another deploy. You need some way to keep track of where these things are actually running at any given moment, and to make sure that you’re monitoring and gathering the right sets of data from that.
In Kubernetes, you define the amount of CPU and memory the container needs to run properly. Since containers consume CPU, memory, I/O, and network resources, it’s important to track how
close things like CPU usage and memory consumption come to the limits you’ve configured. New Relic’s Kubernetes integration uses this information to provide a snapshot of your containers’ resource utilization:
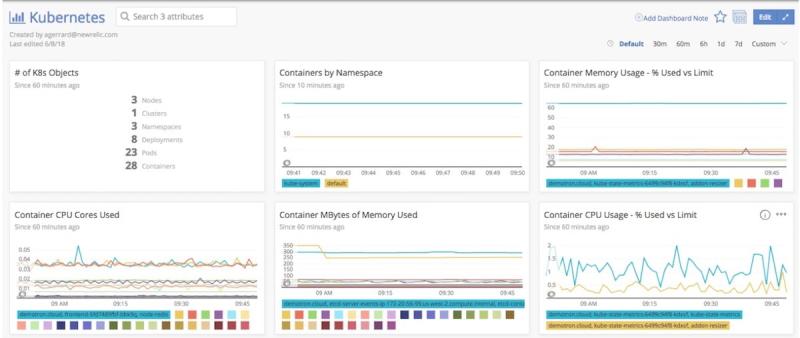
container resource utilization dashboard
What to look for when monitoring container resources:
Monitoring system resources helps ensure that your clusters and applications remain healthy. If you don’t have enough capacity to meet the minimum-resource requirements of all your containers, you should scale up your nodes’ capacity or add more nodes to distribute the workload.
A container approaching its memory limit: If this happens often for containers in the same deployment, it means that the limit is not set correctly or that there is a problem with the application.
A container exceeds its memory request: That container will be among the first to be evicted if the node runs out of memory.
A container exceeds its CPU limits: This could affect performance since Kubernetes could limit the amount of CPU the application can access. New Relic automatically tells you when your CPU usage approaches or exceeds the limit.
Container restarts:
It’s also important to monitor Container restarts. If there are not enough resources available or a cluster is not set up correctly, containers could begin restarting continuously, getting stuck in what’s called a “crash loop backoff.” You can see Container Restarts in New Relic’s Kubernetes dashboard, warning you that you need to address the issue.
Monitor your containers with New Relic
The New Relic platform is designed to provide insight into all layers of the container stack, from applications to services, infrastructure, and customer experience. Using New Relic to take advantage of the power of container orchestration is essential for modern software companies to move faster with confidence.
Learn how to get started monitoring containers in a Docker/Kubernetes environment in the New Relic documentation and deploy New Relic for Docker today!

The views expressed on this blog are those of the author and do not necessarily reflect the views of New Relic. Any solutions offered by the author are environment-specific and not part of the commercial solutions or support offered by New Relic. Please join us exclusively at the Explorers Hub (support.newrelic.com) for questions and support related to this blog post. This blog may contain links to content on third-party sites. By providing such links, New Relic does not adopt, guarantee, approve or endorse the information, views or products available on such sites.


