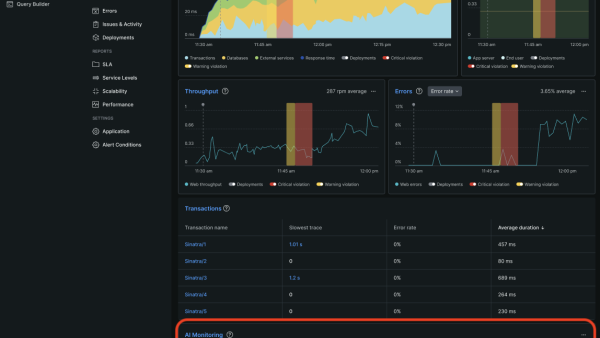
Want to know how you can turn your data into actionable insights? In this comprehensive guide, we'll delve into application analytics and uncover how it empowers developers and stakeholders to harness data-driven decision-making. From understanding the fundamentals to unraveling the pivotal role of application performance monitoring (APM) tools, this article is your gateway to maximizing the potential of application analytics.
What is application analytics?
Application analytics systematically analyzes application-generated data, offering invaluable insights into user behaviors, performance metrics, and error tracking. It's the backbone of informed decision-making in application development, providing a holistic view of its functioning.
Analytics play a pivotal role throughout the application development lifecycle. From the initial design phase to ongoing improvements, analytics guide developers in understanding user engagement, optimizing performance, and addressing issues promptly.
Components of application analytics
There are three main components of application analytics:
User engagement metrics
Understanding how users interact with an application is crucial for its success. Below are the three key user engagement measures.
- User interaction patterns: Analyzing how users navigate through the application, which features they engage with the most, and the sequences of actions they take.
- Navigation pathways: Mapping the routes users commonly take within the application, highlighting popular paths and potential drop-off points.
- Feature popularity: Identifying the most and least used features, providing insights into user preferences and areas that may need improvement.
Performance metrics
The performance of an application directly impacts user experience. Performance metrics offer insights into the application's efficiency and responsiveness.
- Response times: Measuring the time the application takes to respond to user actions or requests.
- Resource utilization: Monitoring the utilization of system resources like CPU, memory, and network bandwidth to optimize performance.
- Latency metrics: Understanding delays or lags in data transmission or processing, ensuring a smooth user experience.
Error tracking and monitoring
Errors and glitches can significantly impact user satisfaction. Comprehensive error tracking and monitoring involve:
- Identifying and rectifying bugs: Detecting and resolving software bugs, ensuring a seamless user experience, and preventing potential issues.
- Real-time error monitoring: Constantly monitoring for errors as they occur, enabling quick identification and resolution to minimize downtime.
Benefits of implementing application analytics
Implementing robust application analytics offers substantial advantages, including:
- Enhanced user experience: Insights from analytics lead to optimized features and smoother user interactions, ultimately enhancing satisfaction.
- Informed decision-making: Developers and stakeholders make data-backed decisions, effectively prioritizing improvements and addressing critical issues.
New Relic APM stands as a cornerstone in this domain. It provides unparalleled visibility into application performance, offering real-time data on various parameters such as response times, database queries, and server resources.
Application insights vs. log analytics
Application insights revolve around real-time monitoring, providing a comprehensive view of an application's performance and user interactions. It focuses on deciphering user behavior patterns, optimizing features, and ensuring a seamless user experience.
On the other hand, log analytics delves into the systematic analysis of logs generated by applications and systems. It primarily aids in debugging, troubleshooting, and scrutinizing system and application logs for errors or anomalies.
| When to use application insights | When to use log analytics |
|---|---|
When to use application insights
|
When to use log analytics
|
How to leverage application performance analytics
Performance analytics in applications plays a pivotal role in ensuring a smooth user experience. Constant monitoring and optimization of different performance aspects helps uphold a seamless app experience for users. It’s a crucial tool in identifying bottlenecks or inefficiencies within the application, allowing for prompt rectification and improved performance.
The key metrics to analyze for application performance are:
- Response times
- Server resource utilization (including CPU, memory and disk space)
- Error rates
Specialized APM tools like New Relic provide a comprehensive set of monitoring and analytics capabilities to offer insights into various performance metrics that facilitate proactive measures and to optimize applications.
How to turn analytics into actionable insights
Establishing clear objectives and key performance indicators (KPIs) allows for focused analysis, ensuring the insights gathered align with the desired outcomes and business objectives. Connecting analytics efforts with overarching business goals ensures that the insights derived are directly impactful and contribute to organizational success.
Analyze user behavior
Analyzing user journeys provides invaluable insights into how users interact with the application, identifying key touchpoints and areas for improvement. Recognizing patterns in user behavior helps in understanding preferences, pain points, and factors influencing user satisfaction, enabling tailored improvements.
Address performance issues
Implementing proactive monitoring systems allows for early detection of performance issues, enabling swift action to prevent or mitigate potential disruptions. Developing and implementing strategies based on analytics insights ensures continual application performance optimization, enhancing overall user experience and satisfaction.
Integrating comprehensive security analytics safeguards the application and serves as a strategic advantage by:
- Identifying and mitigating potential security threats.
- Strengthening the application's security posture.
- Utilizing security analytics to guide proactive security measures, protecting user data, and fostering trust.
Prioritizing analytics isn't just an option; it's necessary for businesses aiming for continual growth. By leveraging insights derived from analytics, developers can fine-tune applications, anticipate challenges, and proactively meet user demands, ensuring sustained success.
New Relic APM monitors application performance and transforms complex data into actionable insights. With New Relic, businesses gain a competitive edge by harnessing the power of analytics to optimize applications and deliver exceptional user experiences.
The views expressed on this blog are those of the author and do not necessarily reflect the views of New Relic. Any solutions offered by the author are environment-specific and not part of the commercial solutions or support offered by New Relic. Please join us exclusively at the Explorers Hub (discuss.newrelic.com) for questions and support related to this blog post. This blog may contain links to content on third-party sites. By providing such links, New Relic does not adopt, guarantee, approve or endorse the information, views or products available on such sites.


