If you were at AWS re:Invent last November, you probably remember the huge cheer that broke out during Amazon Web Services CEO Andy Jassy’s keynote when he announced a preview of Amazon Elastic Container Service for Kubernetes (Amazon EKS). Well, the wait for EKS is over. As of today, it is now generally available—with complete monitoring support from New Relic.
The highly anticipated EKS is AWS’s contribution to the Kubernetes revolution. Designed to allow customers to run Kubernetes on AWS without needing to install or operate their own Kubernetes clusters, EKS alleviates the time-consuming process of manually updating clusters. With a managed service like EKS, customers don’t have to be experts in managing Kubernetes clusters; they can simply launch a cluster and let EKS handle the rest: upgrades, patches, and high-availability management.
EKS + New Relic
While Amazon EKS makes it easier to launch and run Kubernetes, New Relic is designed to provide crucial visibility into your clusters. Because of the ephemeral nature of Kubernetes-based workflows, customers need advanced monitoring at the cluster, node, pod, container, and application level.
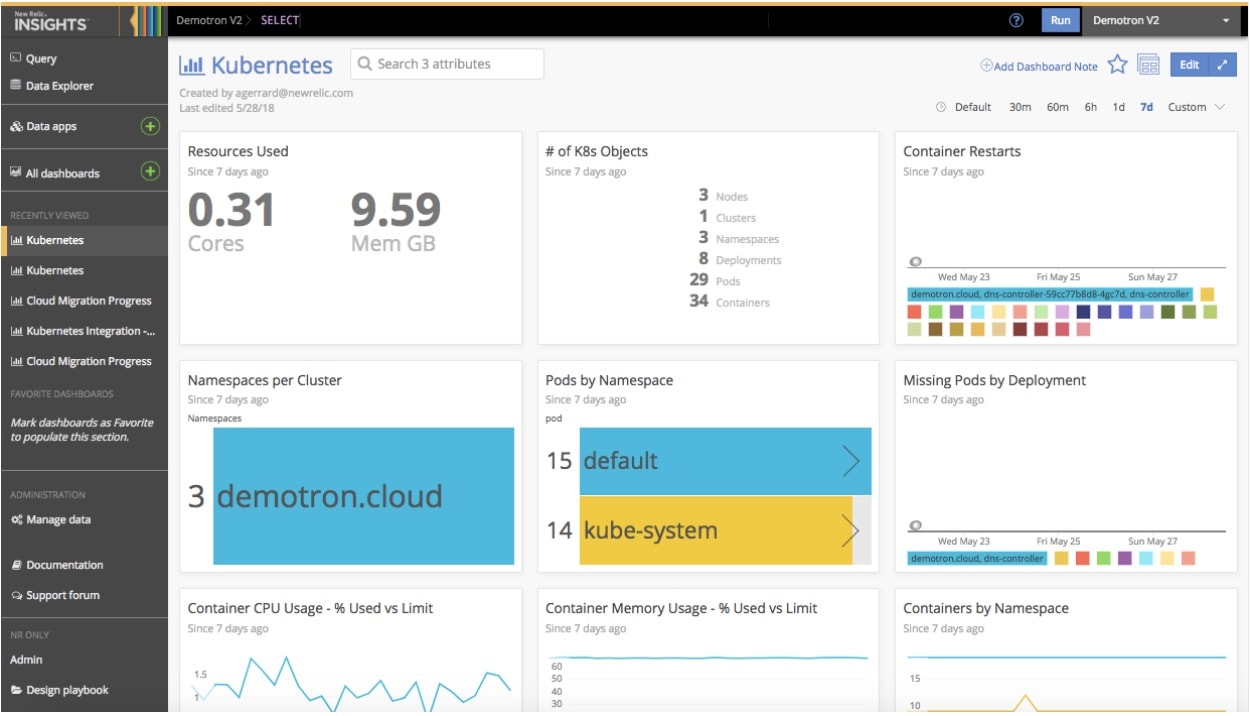
The New Relic Kubernetes integration is what lets customers monitor EKS. The integration collects metrics that monitor data and metadata for nodes, namespaces, deployments, replicasets, pods, and containers, allowing you to fully monitor your frontend and backend applications and hosts running in your Kubernetes clusters. Monitoring EKS with New Relic provides total visibility, alerting, and dashboards for all Kubernetes entities that live in between your applications.
Get started monitoring EKS
Here’s how to activate New Relic’s Kubernetes integration to start monitoring EKS.
Important: You must use the version of kubectl provided by AWS.
- Install Kube-state-metrics.
- Follow the New Relic integration documentation to complete the installation and configuration.
After you install the integration, you’ll have access to the pre-built dashboards for immediate insight into your EKS environment:

New Relic monitoring for EKS can help ensure that your clusters are running as expected, and that you can quickly detect any performance issues within your cluster.
Monitoring Kubernetes everywhere
One of the main draws of EKS is that your applications can move seamlessly across Kubernetes clusters running inside AWS, in on-premise data centers, or in other public clouds. So whether you’re migrating to AWS or taking a multi-cloud or hybrid approach, EKS is designed to be fully compatible with all your Kubernetes deployments—regardless of where they run.
However, running a hybrid containerized environment means that you also need to ensure you have visibility into each environment. Since the New Relic Kubernetes integration also offers complete monitoring for managed services like EKS, as well as for on-premise, hybrid, and public-cloud environments, customers can track the health of their cluster across any platform.
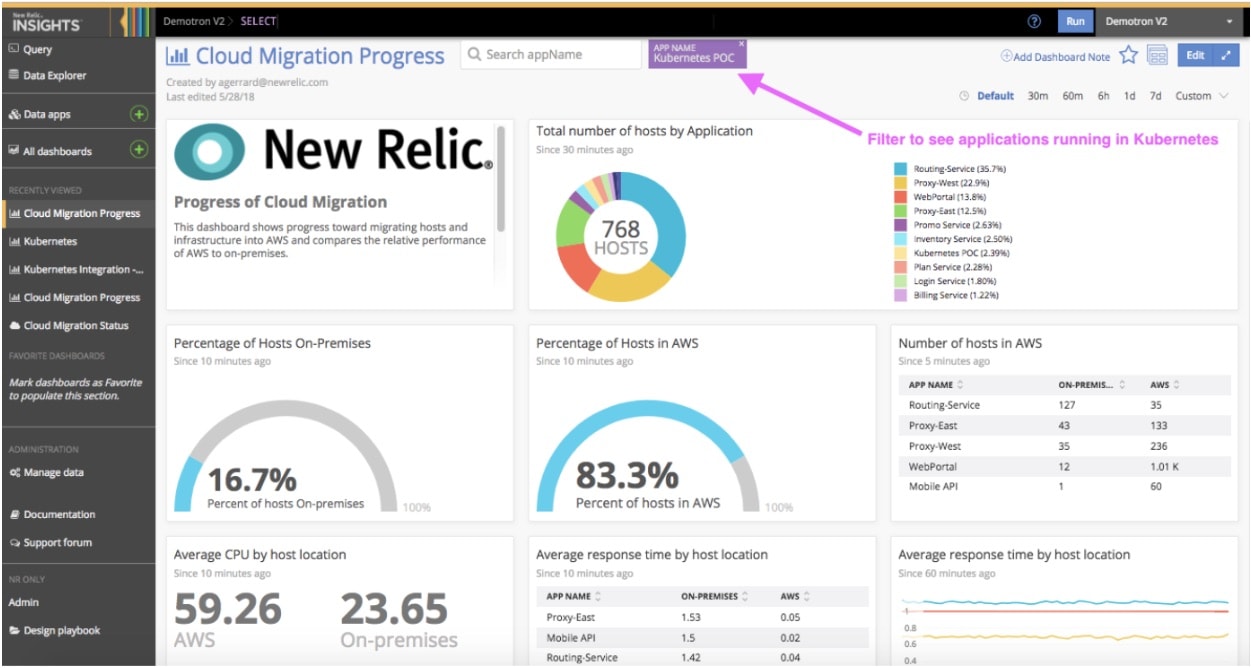
For example, let’s say you’re migrating to AWS and want to drill into the applications you’re already running on Kubernetes. You can quickly filter by appName to get a comprehensive view of which applications are running on-premise versus those you have already migrated to AWS:

No matter how you're using Kubernetes and EKS with AWS, you can trust that New Relic is designed to provide the monitoring you need for both your cloud migration journey and your Kubernetes environment.
Start monitoring Kubernetes in New Relic
The Kubernetes integration is available in public beta to all New Relic Infrastructure customers at the Pro level. Additionally, the integration can be used by customers running Kubernetes on a wide variety of popular cloud, managed SaaS, and on-premise platforms and container services.
Want to see how New Relic helps customers successfully monitor their infrastructure? Check out our case study with ZenHub.
The views expressed on this blog are those of the author and do not necessarily reflect the views of New Relic. Any solutions offered by the author are environment-specific and not part of the commercial solutions or support offered by New Relic. Please join us exclusively at the Explorers Hub (discuss.newrelic.com) for questions and support related to this blog post. This blog may contain links to content on third-party sites. By providing such links, New Relic does not adopt, guarantee, approve or endorse the information, views or products available on such sites.


