In the legacy monitoring world, you likely watched resource consumption (such as CPU, disk, and memory) because those metrics were easy to get to and had a basic correlation to availability and performance. If you engaged in continuous improvement practices, as I did, you quickly ended up collecting a huge list of granular resource metrics and needed to maintain a maze of correlation rules to try to make sense of them.
Now that you’re in the DevOps and observability world, you need more than that. Here’s why:
- Some types of resource consumption can’t (or shouldn’t) be measured in a cloud environment.
- Workloads can be highly variable, so thresholds can be hard to set.
- You need more flexibility over what you’re measuring and control over how you measure it.
- You need to quickly and concisely communicate your status to a wide range of people.
Most important, IT environments are expanding (think microservices here), so you need to simplify what you collect while making it more relevant. If you don’t, your store of metrics will go from huge to ridiculous, and that’s going to increase your administrative toil without adding value.
Taking a different approach by measuring speed and quality
Your customers (both internal and external) expect technology that provides fast and high-quality responses; they aren’t concerned about the gritty details. If you want to meet their expectations on their terms (and you should be, since they’re the ones who hired you), then you should focus on measuring response time (speed) and errors (quality). In addition, you need to boil it all down to a single, easy-to-understand number that shows your Ops and Engineering teams where to focus their attention, and that enables non-technical stakeholders to intuitively understand current status so they can make critical business decisions.
This is important because the business doesn’t care that some process is consuming 2% more CPU than it did earlier—it cares about the customers’ experience. That means you measure and communicate two key things: speed and quality.
That’s where a service-level indicator (SLI) and service-level objective (SLO) come riding to the rescue. You’ll use them to meet the business’s expectations by identifying an SLI metric that is understandable by both technical and non-technical stakeholders. Then you will set a target (an SLO) in the form of a simple percentage that shows you how often you’re meeting your speed and quality obligations.
As an example, here’s data from one of my customer’s microservices called the B2B-Gateway. They’ve been collecting data on the volume of errors over time, like this:
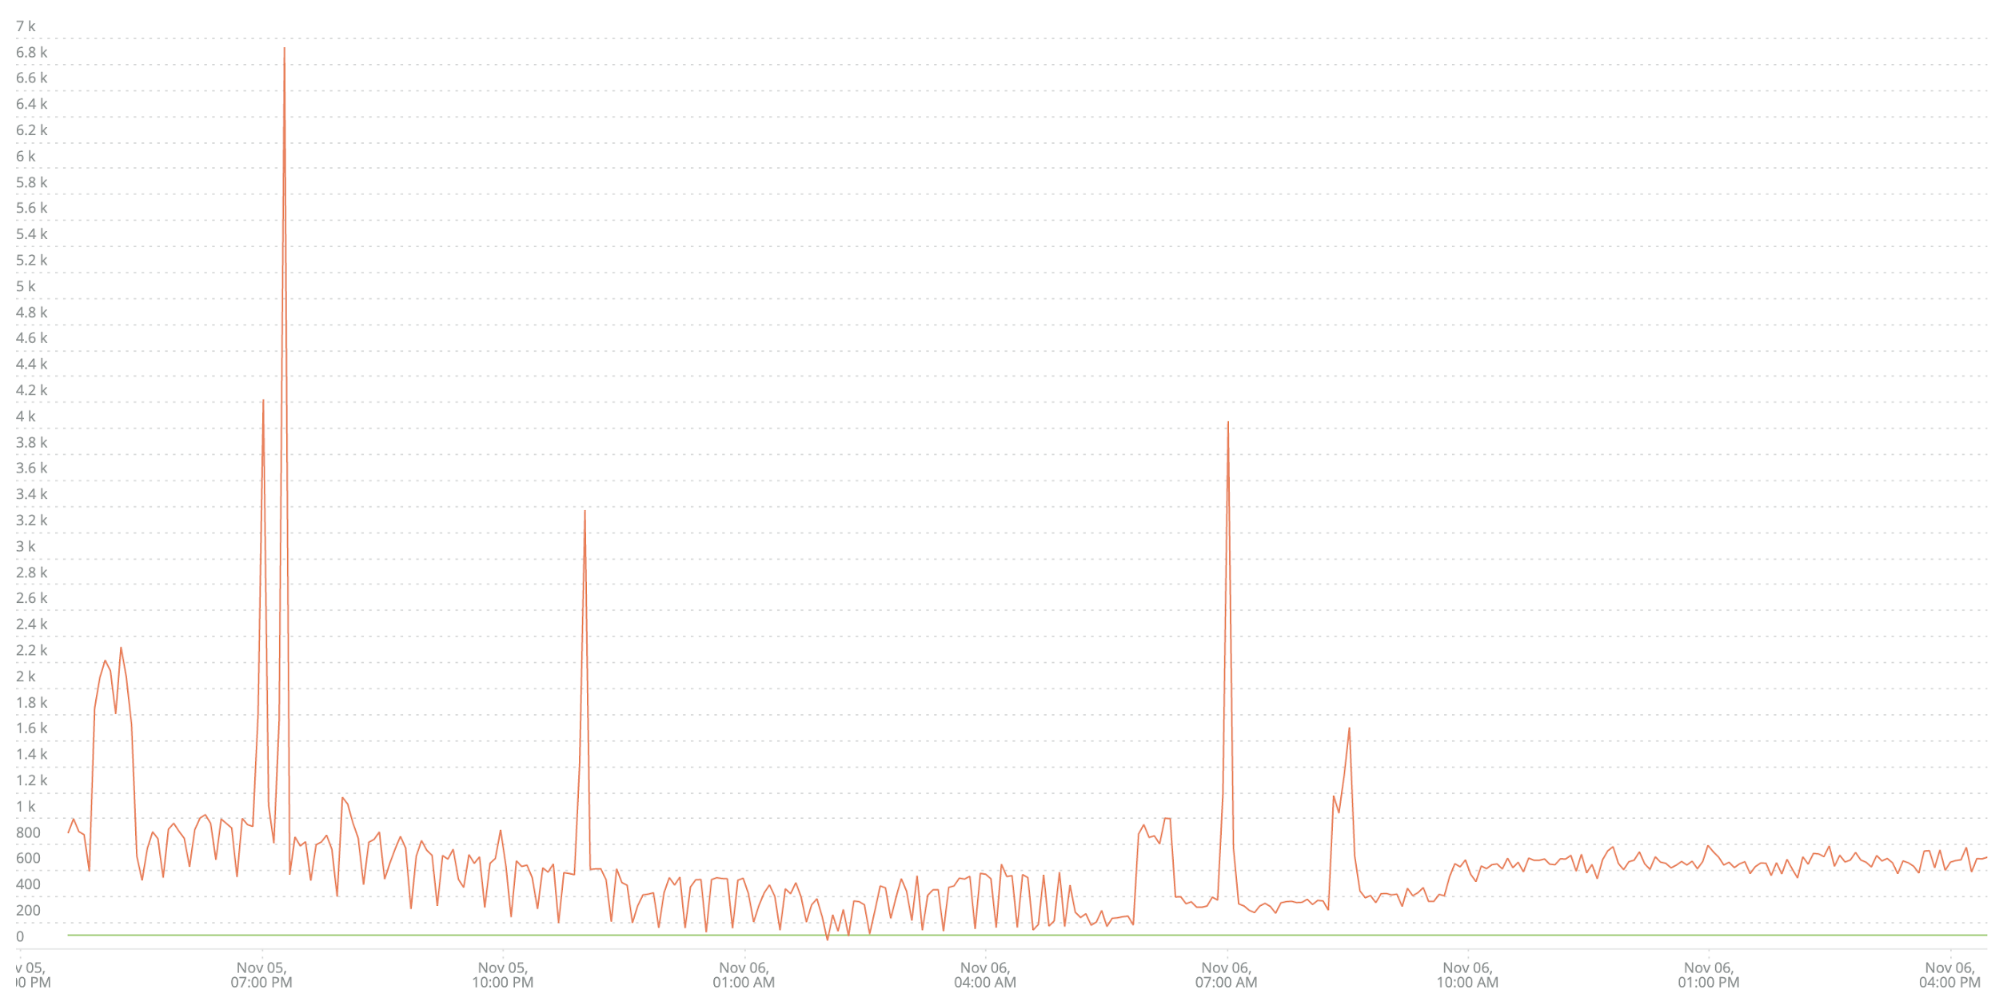
The green line across the bottom is the customer’s alert threshold. As you can see, alerts are continually being asserted against this service. Because of that, their Ops team stopped paying attention to this alert. This is a fantastic example of a low-quality alert—noise that gets ignored.
You could handle this the legacy way by spending a lot of time trying to set a different threshold or looking at fancy deviation from normal algorithms, but that still does not measure the two key factors of speed and quality. Thankfully, we can get from here to there in two easy steps.
Step one: Identify an SLI to measure quality—the percentage of total transactions that are error-free. In a New Relic dashboard, your query would look like this:
FROM Transaction SELECT percentage(count(*), WHERE error IS False) WHERE appName ='b2b-gateway' TIMESERIES MAX SINCE 1 day ago
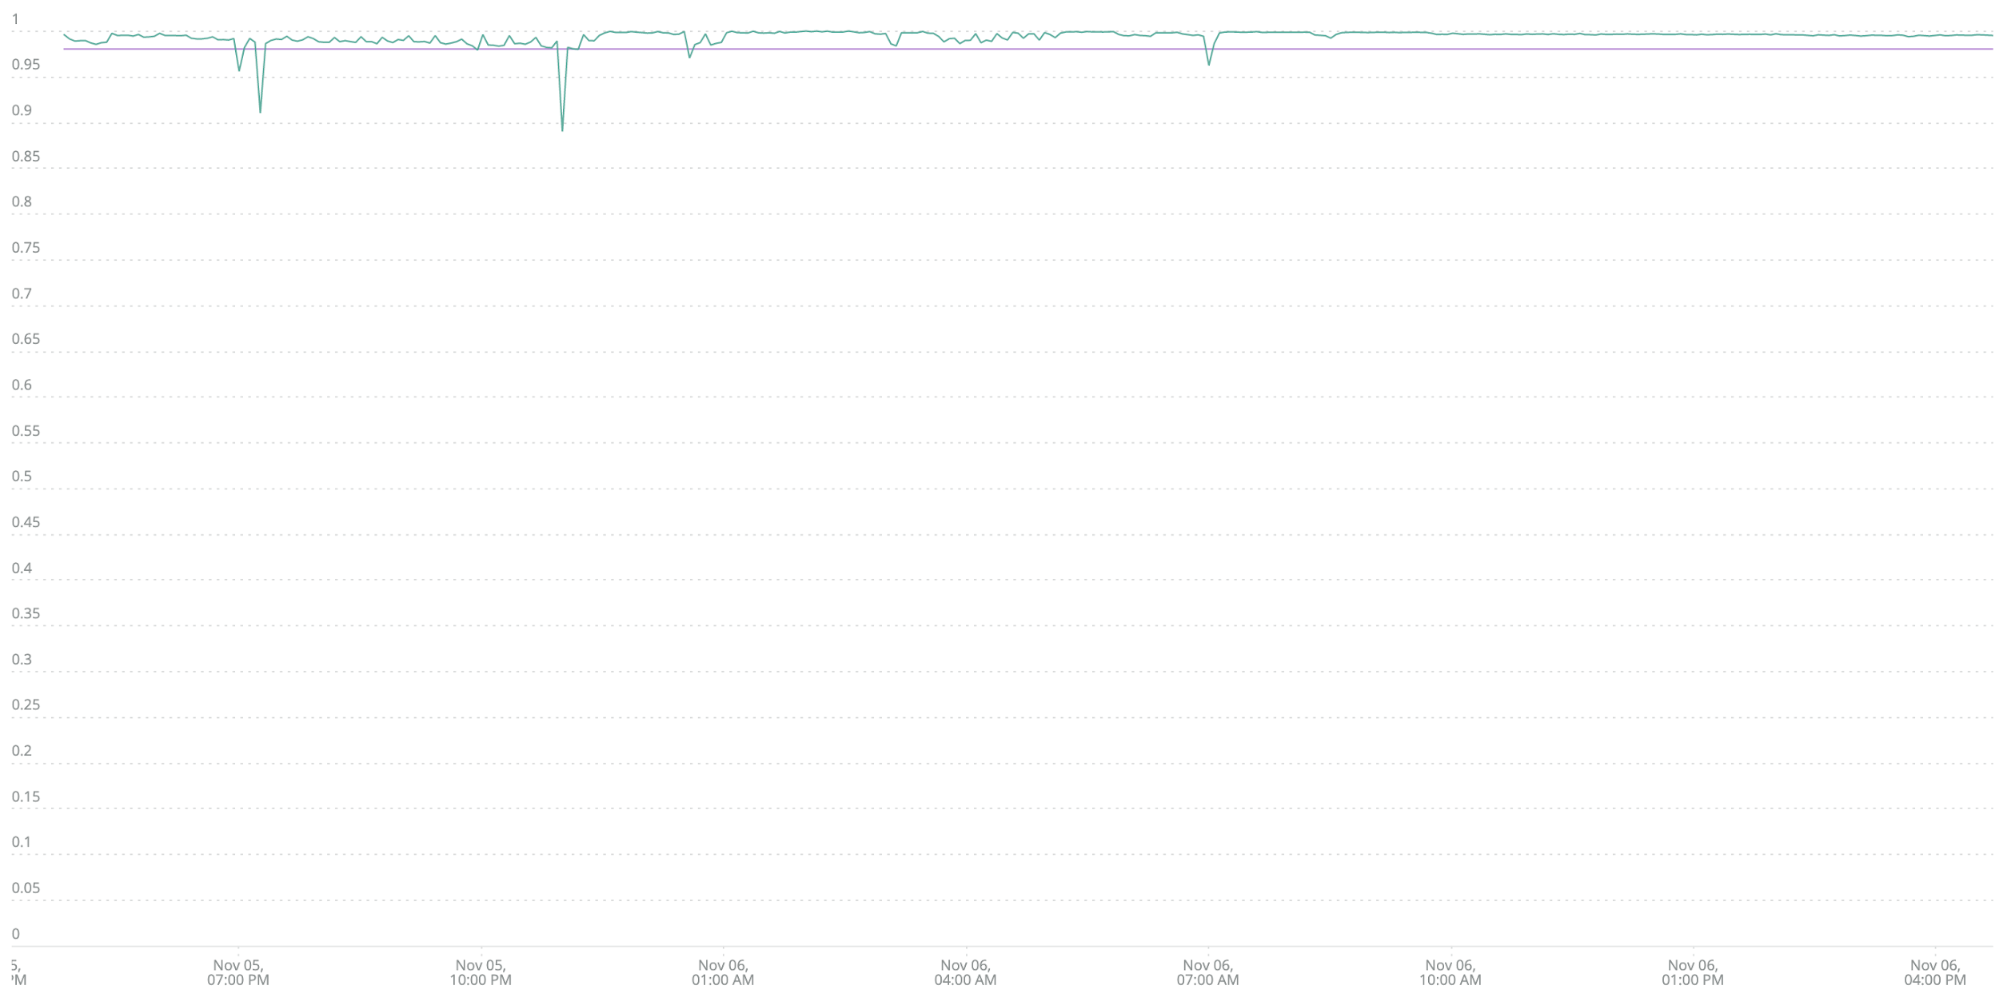
The downward dips in the line show the most significant problems. The purple horizontal line shows the 98% success rate (your SLO). Anything below that threshold is a problem requiring an alert. There are four cases here where your error SLI dips below the 98% threshold (violating your SLO), so you’d get four alerts during the day (in contrast to one alert, asserted 24x7, which everyone ignores).
You’ve just achieved a huge goal: In one simple operation, you’ve created a highly relevant, easy-to-understand business metric (“98% of our transactions are error-free”). In addition, you’ve turned a nuisance alert into a valuable one with real business impact. It’s clear and obvious that an increase in errors will have a direct effect on user experience.
You can easily make this measurement more or less significant by changing the SLI threshold. For example, if it’s still too noisy, you can set it to 97%, or if you need to drive improvement, you can set it to 99%.
Step two: Speed = response time, so let’s add that into the mix.
Continuing with the example, let’s assume that the B2B-Gateway’s response time threshold should be 100 milliseconds (0.1 second). (Stay tuned for our upcoming blog post on how to set SLO thresholds.)
To modify your query to include response time, change it to look like this:
FROM Transaction SELECT percentage(count(*), WHERE error IS False and duration < 0.1) WHERE appName ='b2b-gateway' TIMESERIES MAX SINCE 1 day ago
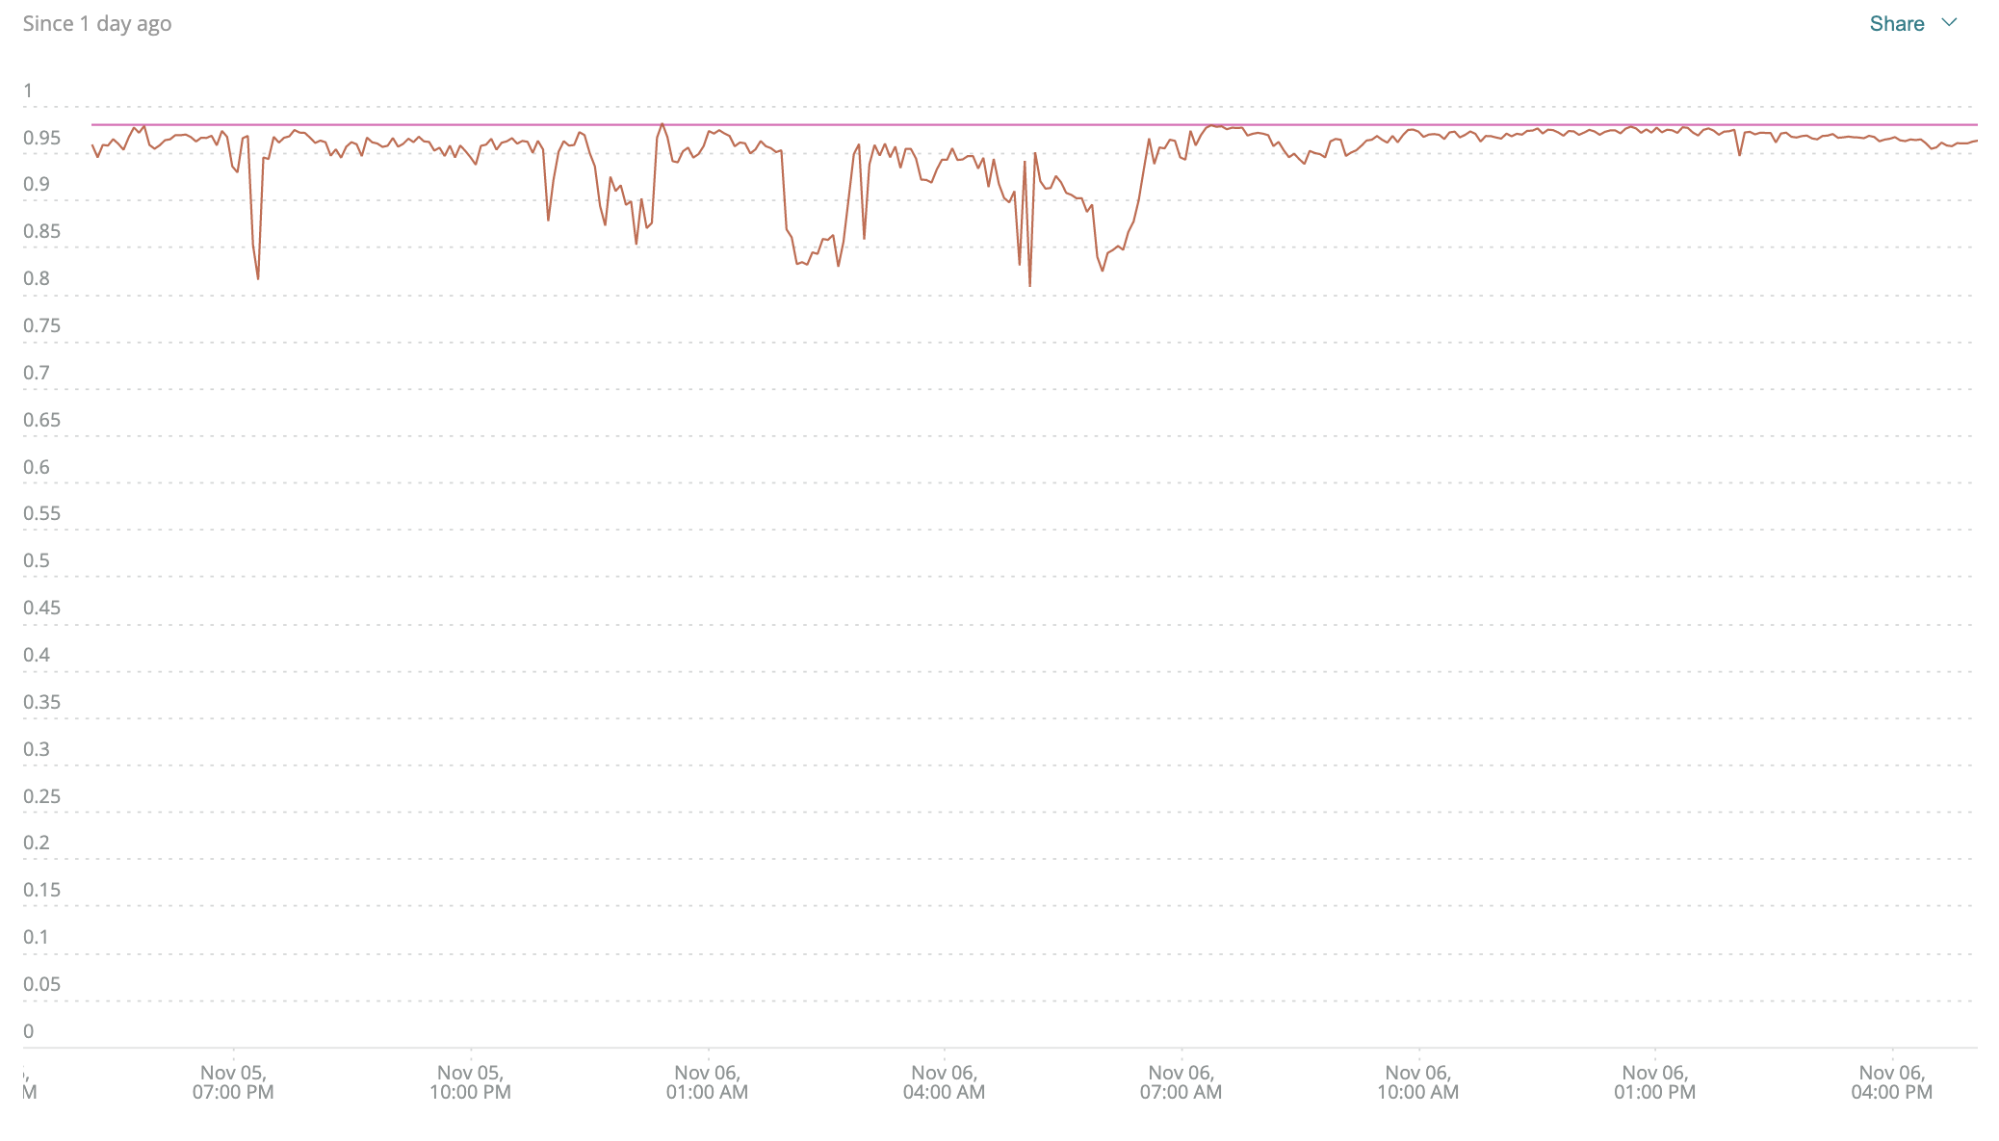
Again, the downward dips show the most significant problems, and the purple line shows the 98% threshold. When you factor in performance, you can see that this service isn’t doing as well as you thought. Quality is good, but the service isn’t meeting its speed obligations. That’s not something you’d ever see by looking at a set of resource consumption metrics. This goes a long way toward closing a fundamental disconnect between IT (whose resource consumption metrics are “perfectly normal”) and the business (who hears about a slow service)—this is a huge win.
To close, let’s review the gains you’ll achieve by measuring speed and quality instead of resource consumption:
Strong business alignment: You have an easily and intuitively understood metric that truly connects the business’ requirements to the technology that delivers them. Metrics like this make it much easier to go to your business stakeholders and say, “Hey, on average, we’re only meeting our performance obligations 94% of the time, so we need to make some changes.”
Clear indicators of trouble: Your SLI is going to highlight problems that have a business impact. That means you’re going to attract attention to real problems faster, which gives you a head start on fixing them quicker and reducing their scope and severity. Don’t forget that this is also going to reduce alert fatigue.
Simplicity: Your SLIs and SLOs (response time and quality) are easy to understand and can be easily modified as needed.
“That’s nice,” you might be saying, “but what should I do next?” Get started by picking a few services in your environment, implementing SLI/SLO-based observability, and comparing results with your existing monitoring. After a few weeks, you’ll likely see that your SLO catches fewer, more critical problems and may even highlight issues that your existing monitoring missed.
Learn more about setting up your team for measurable success.

The views expressed on this blog are those of the author and do not necessarily reflect the views of New Relic. Any solutions offered by the author are environment-specific and not part of the commercial solutions or support offered by New Relic. Please join us exclusively at the Explorers Hub (support.newrelic.com) for questions and support related to this blog post. This blog may contain links to content on third-party sites. By providing such links, New Relic does not adopt, guarantee, approve or endorse the information, views or products available on such sites.


