A version of this post previously ran on Le Journal du Net.
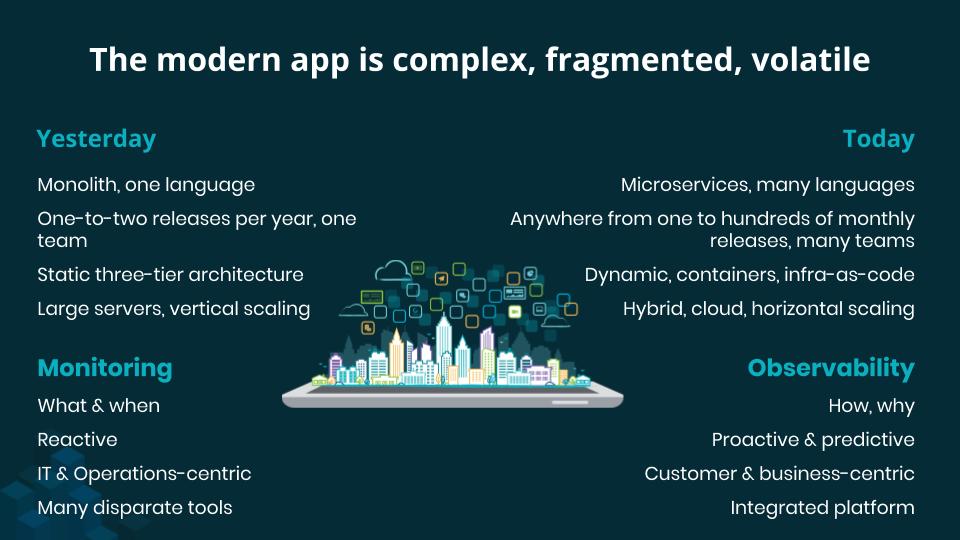
While monitoring is limited to simply informing you when an anomaly occurs in an IT system, observability allows you to understand why it occurs and how your system behaves.
Many recent technologies and practices allow software teams to deploy their production code much more frequently and efficiently, including microservices, cloud, containers, serverless, DevOps, SRE, and infrastructure-as-code. The gains are real, but these approaches also introduce a higher degree of complexity, volatility, and fragmentation of the software architecture, especially when it comes to ensuring availability, quality, performance, and end-user experience.
Observability addresses these new challenges by rethinking monitoring techniques and adapting them to the new technology paradigm. By providing you with a fully connected view of all software telemetry data in one place, real-time observability allows you to proactively master the performance of your digital architecture, accelerate innovation and software velocity, and reduce toil and operational costs. It also enables deeper and shared insights that improve transparency and corporate culture, fostering growth.
Observability goes far beyond monitoring
Simply put, observability is an approach to understanding your complex software system. And core to a winning observability practice is the ability to collect, visualize, and exhaustively analyze telemetry data. While monitoring is limited to simply informing you when a predefined anomaly occurs, observability helps you understand why. This gives teams the ability to react more quickly and effectively in emergencies or continuously improve long-term application performance. Observability requires integrating three essential components:
- Collecting exhaustive and granular telemetry data
- Correlating and contextualizing the data
- Visualizing the data and making it actionable
Complete and open instrumentation for exhaustive and granular telemetry
Modern observability must respond to the complexity of microservices architectures, the increased frequency of software deployments, and the abstraction and volatility of cloud infrastructure and containers. For this, you need to instrument the whole architecture, full-stack, end-to-end—in other words, collect and aggregate telemetry from your infrastructure, virtual machines, containers, Kubernetes clusters, middleware, and software, whether hosted in the cloud or on-premises. And you will also collect telemetry straight from the browser or mobile application to characterize the user experience, and even business events and attributes, so teams can fully understand the links between application and business performance.
Of this comprehensive set of system entities, modern observability collects four major complementary telemetry classes: metrics, events, logs, and traces (M.E.L.T.). It ensures exhaustive and open collection by complementing the telemetry of optimized proprietary agents with that of open source tools—including Prometheus, Telegraf, StatsD, DropWizard, Micrometer for metrics, Jaeger or Zipkin for traces, and Fluentd, Fluent Bit, or Logstash for collecting, filtering, and exporting logs. Modern observability guarantees the interoperability of all types of data and telemetry, whatever the source, by automatically identifying, creating and maintaining entities, and surfacing the connections between them.
Connection, contextualization, and curation
Data aggregation means nothing if you can’t draw insights from it. You must be able to analyze telemetry data in real time to build a mental model of the entities originating this data and of the logical connections between these entities, using metadata to establish accurate correlations or connections and to generate analytical dimensions. This then lets you visualize and understand a complex and dynamic system by—for example—displaying a dynamic service map of microservices dependencies, or a Kubernetes cluster (with its nodes, pods, containers, and applications). Metadata is mainly generated automatically by telemetry agents, but your team may also elect to insert metadata to enrich the context or dimensionality of the data, (e.g., the name of an application, its version, its deployment area, or even business attributes like basket value, loyalty class, product nomenclature, and transaction location).
Data curation is key to surface critical information and insights as quickly and efficiently as possible. It is carried out through carefully designed visualizations and optimized workflows, resulting from the accumulated experience and know-how from thousands of best practice leaders and world-class experts. It helps surface the most important health and performance signals instantly in an obvious way. Curation provides the SRE or the DevOps developer with an opinionated, simple, and effective experience, which makes it possible to identify, isolate, and resolve problems by reaching the “why” behind the data much more quickly.
Centralizing telemetry data in one platform also enables you to apply sophisticated artificial intelligence algorithms to very large data volumes and detect behavior patterns, anomalies, and correlations that would otherwise escape human operators. These AI techniques can provide early automatic detection of incidents as they occur, correlate incidents together, and determine probable root cause, as well as offer rich diagnosis with contextual information and recommendations. This relatively new field, which Gartner names AIOps, greatly improves DevOps teams’ ability to anticipate and resolve issues faster, and significantly reduces alert fatigue.
Visibility, actionability, and programmability
A foundation of observability is to provide data visibility and intelligibility with dashboards and make data more actionable through alert and response workflows. Programmability brings it to the next level.
Alerts defined by your team, or proactive anomaly detection ensured by artificial intelligence, automatically notify you of a condition violation or incident in your service architecture, drastically reducing your mean time to detect. You can then define workflows that execute upon notification of incidents to accelerate or automate incident remediation and resolution, hence reducing your mean time to resolution.
Dashboards are flexible and powerful tools, combining instant and customizable visualizations with multi-dimensional analytics. Dashboards allow you to reconcile software telemetry with trade and business data and enable precise system and business performance management in real time. Dashboards should also be shareable across organizational boundaries, allowing teams to anticipate problems and optimize performance.
Given the immense diversity of businesses, processes, and indicators specific to each company, there is a real need to go beyond dashboards and empower companies to build applications that address their unique business goals. We call this capability programmability. The programmability of an observability platform gives you the freedom to build your own representations and combinations of data, and to introduce other more sophisticated forms of interactivity and processing. By sticking as closely as possible to its specific needs, programmability allows an organization to optimize its software investments, measure its efficiency in real time, and make objective decisions that maximize performance.
Digital transformation has considerably increased expectations that teams innovate faster, and the result is that companies are playing offense with software to guarantee a differentiated end-user experience. As teams adopt DevOps practices, modern architectures and deployment methodologies, traditional monitoring breaks. Observability is now necessary for companies to achieve and maintain optimal speed and performance, differentiate themselves from the competition, and meet customers’ and users’ rising expectations.
Imperatives for modern observability
- OPEN: Collect and correlate all telemetry data (metrics, events, logs, and traces) in real time
- CONNECTED: Leverage rich analytics and a curated user experience to surface the context your teams need to quickly pinpoint and resolve problems across your entire stack
- INTELLIGENT: Apply artificial intelligence for automatic issue detection and diagnosis
- VISUAL: Dashboards give teams a common grounding for analyzing why problems occur and to identify, isolate, and resolve them quickly
- PROGRAMMABLE: Build applications to optimize your software investments, measure efficiency in real time, and make objective decisions to maximize performance
Read more about why the future is open, connected, and programmable.

The views expressed on this blog are those of the author and do not necessarily reflect the views of New Relic. Any solutions offered by the author are environment-specific and not part of the commercial solutions or support offered by New Relic. Please join us exclusively at the Explorers Hub (discuss.newrelic.com) for questions and support related to this blog post. This blog may contain links to content on third-party sites. By providing such links, New Relic does not adopt, guarantee, approve or endorse the information, views or products available on such sites.


