Coding doesn't have to be a horror movie, but sometimes the build process for Jamstack applications reminds us of The Shining.
We can picture Jack Nicholson’s character staring at a replica of a garden maze laid out before him, searching for answers. You need a bird’s eye view to see how you can navigate through a maze, and, like the film, there’s a lot of information being generated under the surface that could have meaning and value.
In our team, when building large websites, we need insight into what is slowing down builds and how our code changes affect build times. Wouldn’t it be great if you could see the entire Jamstack build process in all its detail so you could find a faster way out of the maze?
But have no fear. In this blog post, you’ll learn how to improve efficiency with Gatsby builds by using another open source project, OpenTelemetry.

Source: github.com/gatsbyjs/gatsby
Gatsby is part of a Jamstack architecture and allows you to serve pre-built files over a content delivery network (CDN), which leads to:
- Better performance
- Higher security
- Cheaper, easier scaling
- A better development experience
Why is this important?
Our Developer Enablement team is responsible for several of New Relic's sites built with Gatsby, most notably the docs.newrelic.com site. The Docs site also happens to be one of the largest Gatsby sites in the world with an average build time of more than 45 minutes. The New Relic Docs site is open source, and we are encouraging outside contributions, so build times are incredibly important to streamline that user experience. We also need to streamline the development time spent by our engineers on waiting for the site to build. We need to be more efficient.
The most pressing questions we need to answer regularly are:
- How do we know which APIs and plugins are slowing down the build?
- How do we assess how changes to our code affect build times?
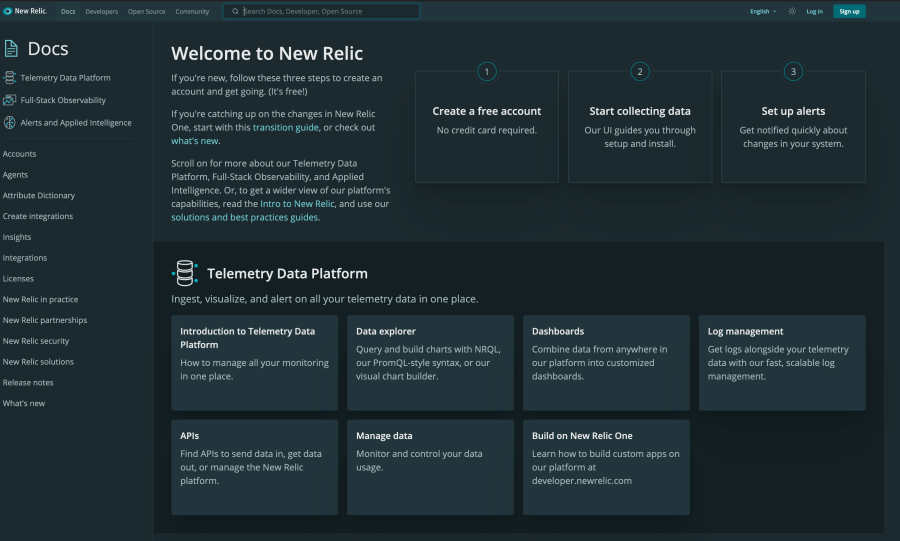
The docs.newrelic.com site has more than 100,000 pages:

New docs homepage, complete with the all-important dark mode
With more than dozens of team members and open source contributors working on the website daily, even a small improvement in the process can make a huge difference in productivity. By leveraging performance tracing built into Gatsby, we are able to use the telemetry data collected for every build to find inefficiencies.
This is where the new OpenTelemetry Collector comes into play. Instead of only collecting trace data in a specific format, for example, zipkin or newrelic, the collector acts as the intermediary, getting data from the instrumentation and sending it to multiple backends to store, process, and analyze the data. You can learn more about OpenTelemetry in our blog series.
In this tutorial, you’ll learn how to send data to Jaegar, an open source backend for telemetry. Then you’ll use New Relic to analyze the traces to gain valuable insights.
Set up your environment
This section shows how to generate an API key in your New Relic account, set up your environment, and set up the OpenTelemetry Collector.
Here’s what you need to get started:
- A Gatsby site (You can use developer.newrelic.com.)
- Docker
- Familiarity with Yarn
- A New Relic account (If you’re not already using New Relic, sign up here to get free, forever access.)
If you’re comfortable with these tools, this tutorial is for you! Let’s go.
1. Set up your New Relic account
To generate an Insights insert key, go to one.newrelic.com and complete the following steps:
- Select API keys from the menu:
- Under API key types, select Insights insert key.
- Then click the + icon to create the insert key:
-
Then set it as an environment variable in your terminal:
export NEW_RELIC_INSERT_KEY=<INSERT_KEY>
2. Set up the OpenTelemetry container
You can set this up on your local machine, or any remote host. If you use a remote host, be sure to change the endpoint parameter to the IP address of the remote host.
- Create a file called
otel-config.yamllike the following example:
extensions:
  health_check:
receivers:
  jaeger:
    protocols:
      thrift_http:
        endpoint: "0.0.0.0:14268"
processors:
  batch:
    timeout: 1s
exporters:
  otlp:
    endpoint: otlp.nr-data.net:4317
    headers:
      api-key: ${NEW_RELIC_INSERT_KEY}
service:
  pipelines:
    traces:
      receivers: [jaeger]
      processors: [batch]
      exporters: [otlp]
extensions: [health_check]- Make sure the Docker Daemon is running.
- Run the following command in the terminal from the same directory as
otel-config.yaml:
docker run --rm -e NEW_RELIC_INSERT_KEY -p 13133:13133 -p 8888:8888 -p 6831:6831 -p 14268:14268 -p 55680-55681:55680-55681 -v "${PWD}/otel-config.yaml":/otel-config.yaml --name otelcol otel/opentelemetry-collector --config otel-config.yamlConfigure Jaeger to your Gatsby website
Jaeger is an open-source, end-to-end distributed tracing tool available for JavaScript. The Gatsby package already includes a sample configuration file for Jaeger, so it's easy to set up and start reporting data.
1. Install the Jaeger client in your project by running the following commands:
yarn add jaeger-client
npm i --save jaeger-client
2. Configure the Jaeger collector.
In the jaeger-local.js file located in the ./node_modules/gatsby/dist/utils/tracer/ directory, change the following values:
- serviceName: Use the Entity it reports under in New Relic One.
- Tags: Add your own “tags,” depending on your needs for filtering. Tags display as attributes in the Distributed Tracing UI.
- gatsbySite: Set this value to true if you want your site to show up as a Gatsby Build Entity.
function create() {
  // See schema
  // https://github.com/jaegertracing/jaeger-client-node/blob/master/src/configuration.js#L37
  const config = {
    serviceName: `docs.newrelic.com`,
    reporter: {
      // Provide the traces endpoint; this forces the client to
      // connect directly to the Collector and send spans over HTTP
      collectorEndpoint: `http://localhost:14268/api/traces`
    },
    sampler: {
      type: `const`,
      param: 1
    }
  };
  const options = {
    tags: {
      gatsbySite: `docs.newrelic.com`,
      build: `development`,
    }
  };
  tracer = (0, _jaegerClient.initTracer)(config, options);
  return tracer;
}
3. Run the build command.
You need to add the tracing flag to the build command. It should work with any Gatsby command:
yarn build:production --open-tracing-config-file node_modules/gatsby/dist/utils/tracer/jaeger-local.jsYou'll now see an example dashboard that shows data points of the Gatsby build, including build times, split up by steps, plug-ins, and hosting provider:
Source: www.jaegertracing.io.
All work and no dashboards makes data a dull boy
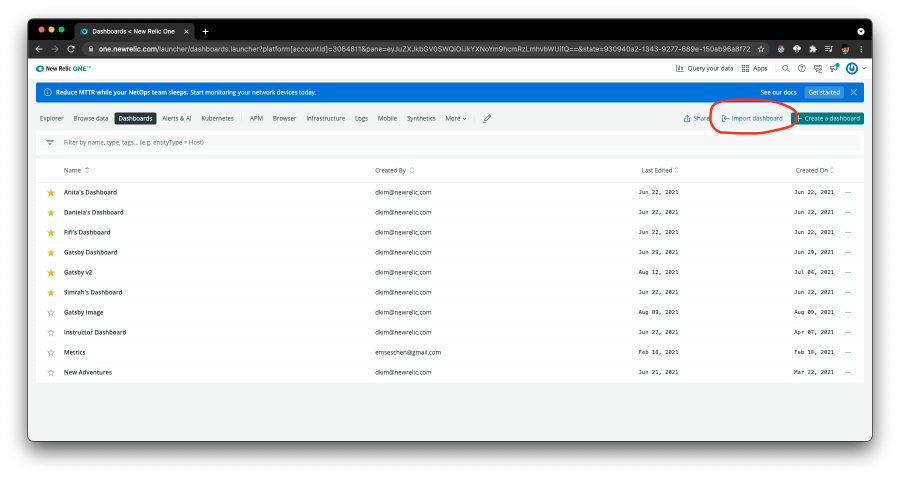
Now, to visualize your data in New Relic One, download this example JSON file and import it as a dashboard:
- On the Dashboards tab of New Relic Explorer, click Import dashboard:

- Paste in the JSON file, and select Import Dashboard to create your dashboard.
It should look something like this:
See entity definition for details on how to create our own entity definition.
Next steps
This is the first step in a Gatsby plugin project, which can collect traces, metrics, and logs from your site's build without a Docker container. We hope to make it even easier to get your data into New Relic!
Want to try some other tutorials?
- To use telemetry data to optimize builds for Gatsby websites, see Best practices for optimizing build times for Gatsby applications.
- To instrument Node.js apps with OpenTelemetry, see Intro to OpenTelemetry for Node.js Apps with New Relic and freeCodeCamp.org.
- To measure the performance of a Jamstack application, including measuring traffic and tracking errors, see How to measure Jamstack application performance.
The views expressed on this blog are those of the author and do not necessarily reflect the views of New Relic. Any solutions offered by the author are environment-specific and not part of the commercial solutions or support offered by New Relic. Please join us exclusively at the Explorers Hub (discuss.newrelic.com) for questions and support related to this blog post. This blog may contain links to content on third-party sites. By providing such links, New Relic does not adopt, guarantee, approve or endorse the information, views or products available on such sites.


