The following is adapted from a series of best practice guides that reflect the New Relic Community Team’s work with thousands of customers—identifying challenges and coming up with actionable solutions for organizations getting started with New Relic Insights. Also, check out our guides to getting started with New Relic APM, New Relic Mobile, New Relic Browser, New Relic Infrastructure, and New Relic Synthetics; and discover the New Relic Community Team’s latest Best Practice Guide offerings.
The New Relic platform generates astounding quantities of data about your applications and environments. The insights within those data flows can transform your ability to make decisions, to stay competitive, and to keep your applications and infrastructure running at peak performance.
New Relic Insights is your key to unlocking the full value and potential within all of this data. Insights doesn’t just collect and manage data; it performs a wide range of analytical tasks, and it presents insights using visualizations and other highly intuitive, easy to use tools.
Working with Insights can be a complex task—but it doesn’t have to be. In this guide, we’ll get you started with our most popular and useful tips for working with New Relic Insights, based on our work helping thousands of actual users. We’ll also point the way to documentation and other resources you can use to continue your path to mastery with Insights and other New Relic applications.

(If you’re completely new to New Relic, we suggest starting with this primer and series of short videos that give New Relic newbies a quick but thorough introduction to our family of applications, the technology that powers them, and their place in modern software development.)
Getting started and organized with New Relic Insights
NRQL -> Widgets -> Dashboards -> Data Apps
There are four basic building blocks to the New Relic Insights user experience. It’s important to understand how these work together to make Insights powerful and flexible, while also helping Insights stay intuitive and relatively easy to use:
- NRQL (New Relic Query Language) is a SQL-like query language that is optimized for use with the New Relic platform. (We strongly recommend taking the time to learn more about creating NRQL queries—a step that will help you to extract a wide range of business-critical insights from your data within New Relic Insights.)
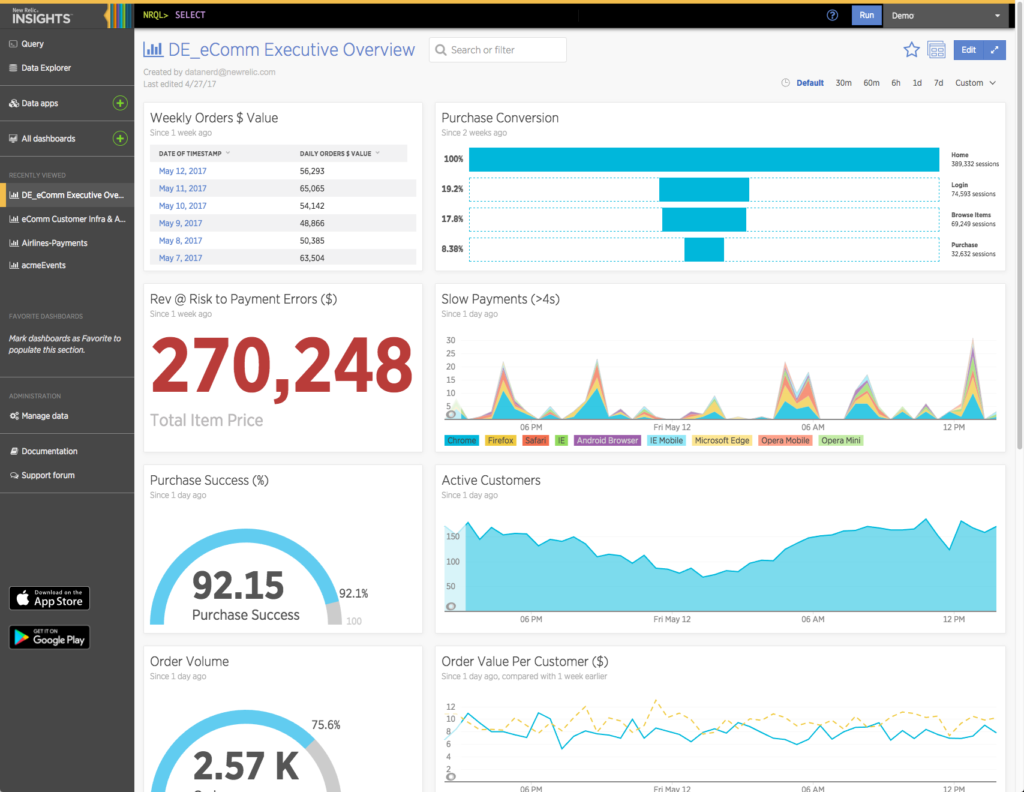
- When you run a NRQL query, it can return the results in the form of a data visualization, such as a chart, table, or histogram, among many other options. We refer to these as widgets in the context of the New Relic Insights.
- Widgets can be combined to create dashboards that display tailored information about your application's performance, your users' actions, or a combination of these elements.
- Finally, data apps are collections of linked dashboards that create a curated, application-like experience for Insights users. You can also use the FACET widget to link to a pre-filtered dashboard—giving users an intuitive (and easily implemented) way to navigate between your dashboards.
Learn more about data apps and dashboards in New Relic Insights
This video tutorial offers a good introduction to how data apps and dashboards work together in New Relic Insights, along with tips on how to create dashboards:
The New Relic Insights documentation provides detailed guidance on how to Create and Edit Insights Dashboards as well as how to use Insights data apps to build a collection of linked dashboards.
Get familiar with the Insights dashboard API
Most DevOps teams depend on APIs to distribute and share information between the systems they manage and across their organizations. The Insights dashboard API serves the same purposes, as it:
- Gives you programmatic control over your dashboards
- Makes it easier for other users within your organization to see and configure dashboard and widget data
- Ensures that teams can benefit from a shared understanding of your Insights data.
These capabilities are especially important since DevOps teams in different parts of an organization often need to monitor and solve the same problems. Due to the structure of their New Relic accounts, teams can’t necessarily access or even see how other teams are working with their Insights dashboards—a situation that can create confusion and needless duplication of work. Teams can close this gap by using the API to create JSON “templates” of their dashboards, which they can store in a shared repository and push to any other team or account in the organization.
When you start working with the Insights dashboard API, keep one important point in mind: Create shared dashboards that reference default attributes, not custom data. Other accounts may not have visibility into your custom data attributes, so they may not get value from shared dashboards that use custom data.
The New Relic Insights Dashboard API—Get More Programmatic Control Over Your Dashboards offers an excellent introduction of the Insights dashboard API and its capabilities. In addition, New Relic University has a course on Managing Insights Dashboards with the New Relic REST API that can sharpen your dashboard management skillset.
Add Dashboard descriptions with notes
Dashboard notes are a great way to add comments to your dashboards, so you can help other users understand the purpose of a dashboard or explain how to use it. Dashboard notes support Markdown, so you can add titles, headings, images, and other formatting elements.
Understanding your New Relic Insights data
Use the data formatter to set default numeric value formats
Insights automatically formats the data returned by your NRQL queries. For example, when a query returns long integers that can be read as a unix timestamp, Insights will convert them to human readable values. The Insights data formatter gives you control over the default formats for attributes with numeric values, including rounding, comma usage, and the number of digits visible after a decimal point.
Keep in mind that changes you make with the data formatter always apply on an account-wide basis.
Get a detailed introduction to using the New Relic Insights data formatter with this New Relic University tutorial.
Explore and understand attributes
New Relic agents collect and send a wide variety of data to New Relic Insights. The Attribute Dictionary helps you to understand these data types so that you can build more useful and efficient queries, and understand the results of your queries.
Using the Attribute Dictionary is easy: Select the event type or the data source you want to explore, and you’ll get a detailed definition of every attribute that is collected from that event or source.
Metric explorer and event explorer
Sometimes you need to drill into specific metrics, like the CPU percent utilization per host for a single application. In such cases, you'd use the Insights metric explorer to pick an application and dig deeper into each of the metrics that it reports. Add these charts to your dashboards for a centralized view of metric data alongside your NRQL event charts.
New Relic maintains an API explorer - metric names application that will return a list of known metrics and their value names for a given set of parameters. You can also learn about requesting and using metric values in the documentation.
Using Insights to make your data actionable
Create NRQL alerts
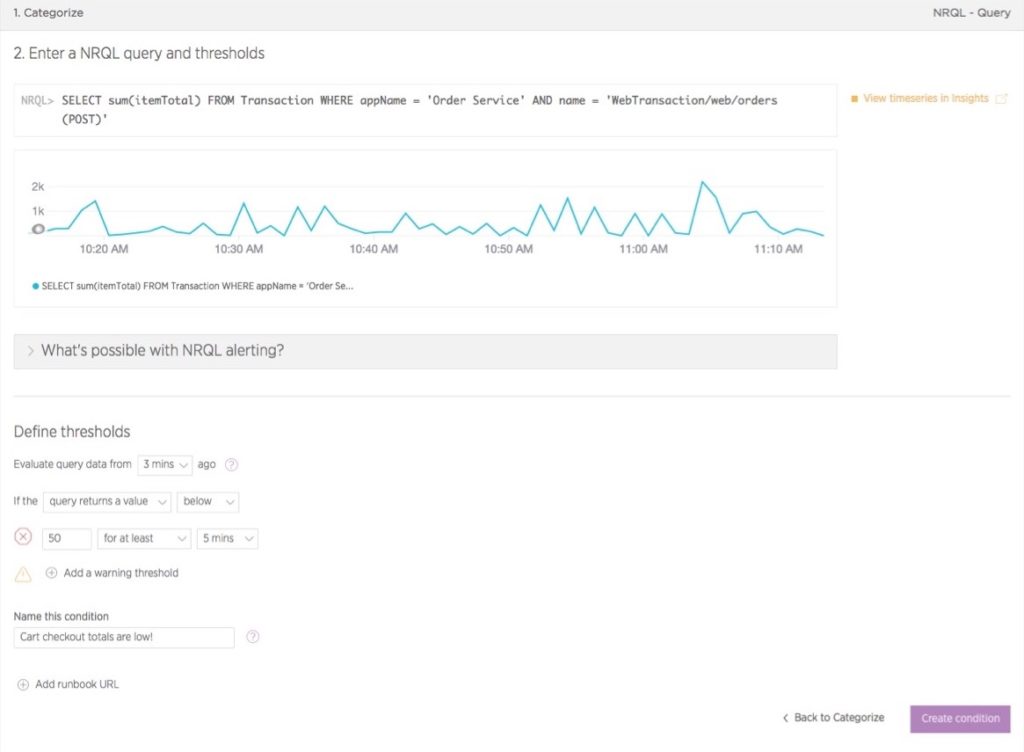
When customers begin working with NRQL, they often discover that changes in query results may point to underlying application or infrastructure issues that require immediate attention. Use NRQL to set an alert on any query that returns a single numeric value —giving your team another channel for monitoring and making use of these important insights.
New Relic support documents include detailed guidance on creating NRQL alert conditions.

Send custom data
Insights is extremely powerful thanks to its flexible and highly extensible architecture. While the New Relic platform collects a huge variety of standard data attributes, New Relic Insights also supports the ability to collect and process custom data attributes. Insights gives you several ways to send custom data—through an agent, for example, or directly through the Insert API. Once you load your custom data into Insights, you can use it to build dashboards and to take advantage of most other standard analysis and reporting capabilities.
Begin with a thorough overview of how to send custom data to New Relic Insights. You can also learn more about using the Event API to send custom data to Insights.
Ready to expand your knowledge of New Relic Insights?
Looking for more best practices and tips for New Relic Insights? Check out the Insights level up category pages in the New Relic Explorers Hub, and discover a wealth of community-generated resources on these and related topics. When you’re ready, test your Insights knowledge by taking our Insights Best Practices Quiz and earning your proficiency badge!
The views expressed on this blog are those of the author and do not necessarily reflect the views of New Relic. Any solutions offered by the author are environment-specific and not part of the commercial solutions or support offered by New Relic. Please join us exclusively at the Explorers Hub (discuss.newrelic.com) for questions and support related to this blog post. This blog may contain links to content on third-party sites. By providing such links, New Relic does not adopt, guarantee, approve or endorse the information, views or products available on such sites.


