Garbage collection is a key feature for developers who build and compile Java programs on a Java Virtual Machine, or JVM. Java objects are created on the heap, which is a section of memory dedicated to a program. When objects are no longer needed, the garbage collector finds and tracks these unused objects and deletes them to free up space. Without garbage collection, the heap would eventually run out of memory, leading to a runtime OutOfMemoryError.
Java garbage collection helps your Java environments and applications perform more efficiently. However, you can still potentially run into issues with automatic garbage collection, including poor application performance. While you can’t manually override automatic garbage collection, there are things you can do to optimize garbage collection in your application environment, such as changing the garbage collector you use, removing all references to unused Java objects, and using an application monitoring tool to optimize performance and detect issues as soon as they arise.
The basics of Java garbage collection
Garbage collection in Java is the automated process of deleting code that’s no longer needed or used. This automatically frees up memory space and ideally makes coding Java apps easier for developers.
Java applications are compiled into bytecode that may be executed by a JVM. Objects are produced on the heap (the memory space used for dynamic allocation), which are then monitored and tracked by garbage collection operations. Most objects used in Java code are short-lived and can be reclaimed shortly after they are created. The garbage collector uses a mark-and-sweep algorithm to mark all unreachable objects as garbage collection, then scans through live objects to find objects that are still reachable.
Automatic garbage collection means you don’t have control over whether and when objects are deleted. This is in contrast to languages like C and C++, where garbage collection is handled manually. However, automatic garbage collection is popular for good reason—manual memory management is cumbersome and slows down the pace of application development.
How does garbage collection work in Java?
During the garbage collection process, the collector scans different parts of the heap, looking for objects that are no longer in use. If an object no longer has any references to it from elsewhere in the application, the collector removes the object, freeing up memory in the heap. This process continues until all unused objects are successfully reclaimed.
Sometimes, a developer will inadvertently write code that continues to be referenced even though it’s no longer being used. The garbage collector will not remove objects that are being referenced in this way, leading to memory leaks. After memory leaks are created, it can be hard to detect the cause, so it’s important to prevent memory leaks by ensuring that there are no references to unused objects.
To ensure that garbage collectors work efficiently, the JVM separates the heap into separate spaces, and then garbage collectors use a mark-and-sweep algorithm to traverse these spaces and clear out unused objects. Let’s take a closer look at the different generations in the memory heap, then go over the basics of the mark-and-sweep algorithm.
Generational garbage collection
To fully understand how Java garbage collection works, it’s important to know about the different generations in the memory heap, which help make garbage collection more efficient. These generations are split into these types of spaces:
Java eden space
The eden space in Java is a memory pool where objects are created. When the eden space is full, the garbage collector either removes objects if they are no longer in use or stores them in the survivor space if they are still being used. This space is considered part of the young generation in the memory heap.
Java survivor spaces
There are two survivor spaces in the JVM: survivor zero and survivor one. This space is also part of the young generation.
Java tenured space
The tenured space is where long-lived objects are stored. Objects are eventually moved to this space if they survive a certain number of garbage collection cycles. This space is much larger than the eden space and the garbage collector checks it less often. This space is considered the old generation in the heap.
So how do these different spaces make garbage collection more efficient? Well, garbage collection occurs most frequently in the eden space because many new objects don’t need to stay in memory for very long. However, it wouldn’t make sense for the garbage collector to keep checking uncollected objects over and over, particularly if an object needs to remain in the heap for a long time. That’s an inefficient use of the collector. By moving objects into survivor and tenured spaces, the garbage collector knows that there is a higher likelihood that the objects there will need to remain in memory, so it checks those areas less frequently. Because the tenured space is much larger than the eden space, it fills up less regularly and the garbage collector doesn’t check it as much. The potential downside is that the tenured space is more prone to memory leaks since it isn’t checked as regularly.
The garbage collection cycles in the young generation (eden and survivor spaces) are considered minor garbage collection. The garbage collection cycles in the old generation (tenured space) is known as old garbage collection or major garbage collection because it takes longer than minor garbage collection. As you might guess, the minor garbage collection cycle is a simpler and faster process than major garbage collection, which makes sense because it occurs much more frequently and needs to be efficient.
In past versions of Java (before Java 8), there was a third area of memory known as permanent generation (perm gen or PermGen) that included required application metadata for the JVM. However, the permanent generation was removed in Java 8.
Mark-and-sweep
The Java garbage collection process uses a mark-and-sweep algorithm. Here’s how that works:
- There are two phases in this algorithm: mark followed by sweep.
- When a Java object is created in the heap, it has a mark bit that is set to 0 (false).
- During the mark phase, the garbage collector traverses object trees starting at their roots. When an object is reachable from the root, the mark bit is set to 1 (true). Meanwhile, the mark bits for unreachable objects is unchanged.
- During the sweep phase, the garbage collector traverses the heap, reclaiming memory from all items with a mark bit of 0 (false).
Java garbage collection benefits
Java garbage collection offers several benefits for memory management in Java applications. Here are the most important:
- Automatic memory management:
Garbage collection automates the memory management process, reducing the burden on developers to manually allocate and deallocate memory.
- Prevention of memory leaks:
Garbage collection helps prevent memory leaks by automatically reclaiming memory occupied by objects that are no longer reachable or referenced by the program.
- Increased productivity:
Developers can focus more on application logic and features without worrying extensively about memory management, leading to increased productivity and faster development cycles.
- Enhanced application stability:
Automatic memory management reduces the likelihood of memory-related errors, such as segmentation faults or access violations, contributing to enhanced application stability.
- Adaptability to varied workloads:
Java provides different garbage collection algorithms to suit diverse application workloads and requirements. This adaptability allows developers to choose the most appropriate algorithm for their specific scenarios.
- Optimized performance:
Efficient garbage collection algorithms, when tuned properly, contribute to optimized performance by minimizing pause times and ensuring that the application spends more time executing useful code.
What triggers Java garbage collection?
There are three major types of events that trigger garbage collection in the heap.
- Minor events: These occur when the eden space is full and objects are moved to a survivor. A minor event happens within the young area.
- Mixed events: These are minor events that reclaim old generation objects.
- Major events: These clear space in both the young and old generations, which takes longer than other types of garbage collection events.
Java garbage collection types & strategies
Java includes four different options for garbage collectors, each with its own pros and cons.
Serial garbage collector
The serial garbage collector is typically used for smaller, single-threaded environments. Don’t use it in a production environment because the process of garbage collection takes over the thread, freezing other processes. This is known as a “stop the world” event.
Parallel garbage collector
The parallel garbage collector is JVM’s default garbage collector. As the name implies this garbage collector uses multiple (parallel) threads. Because it can also use multiple CPUs to speed up throughput, it’s also known as the throughput collector. However, when running garbage collection, it will also freeze application threads.
Concurrent mark-and-sweep (CMS) collector
Like the parallel garbage collector, the concurrent mark-and-sweep collector uses multiple threads. However, this collector is known as a “low-pause” collector because it freezes application threads less frequently, making it more appropriate for user-facing applications where “stop the world” events will cause issues for your users. It can only garbage collect the old generation concurrently, though—it still needs to freeze execution when collecting the young generation. Also, because the collector’s threads execute at the same time as the application’s threads, it does use more processing power than other garbage collectors.
Garbage first (G1) garbage collector
The G1 garbage collector takes a different approach altogether. Instead of collecting the young and old generations separately, it can collect both at once by splitting the heap into many spaces—not just the eden, survivor, and tenured spaces that other garbage collectors use. This allows it to clear smaller regions instead of clearing large regions all at once, optimizing the collection process. It runs concurrently like the CMS collector, but it very rarely freezes execution and can collect both the young and old generations concurrently.
Is it possible to force garbage collection?
Unfortunately, you can’t force garbage collection, even if your JVM is utilizing close to 100% of the heap. However, there are a few tricks you can use to help ensure that Java objects are garbage collected.
Ensuring a Java object is removed during garbage collection
You can’t force garbage collection on a specific object, but you can update objects so they are no longer accessible to the rest of the application. This lets the garbage collector know that those objects should be removed.
You can make objects inaccessible in the following ways:
- Create an object inside a method. After methods are executed, all objects called within those methods become unreachable, which makes them eligible for garbage collection.
- Nullify the reference variable. You can change a reference variable to NULL. As long as all references to an object are removed, that object will become unreachable, which lets the garbage collector know the object can be removed.
- Reassign the reference variable. Instead of nullifying the reference variable, you can also reassign the reference to another object. Once again, as long as all references to an object are removed, either through making reference variables NULL or reassigning them, the object will become inaccessible, leading to it being removed during the garbage collection process.
- Create an anonymous object. An anonymous object doesn’t have a reference, so the garbage collector will mark and remove it during the next garbage collection cycle.
Java garbage collection best practices
Java garbage collection best practices may vary based on the specific characteristics of your application. We recommend regularly assessing and adjusting your garbage collection strategies to meet evolving performance demands. Here are some strategies to get you started:
- Choose the right garbage collector:
Select a garbage collector based on your application's requirements and characteristics. Different collectors are optimized for various scenarios, such as low latency, throughput, or minimal pause times.
- Monitor and analyze garbage collection logs:
Regularly analyze garbage collection logs to identify patterns, diagnose issues, and fine-tune garbage collection settings.
- Optimize heap size:
Adjust the heap size to match the application's memory requirements. An appropriately sized heap helps avoid issues like frequent garbage collection or out-of-memory errors.
- Tune garbage collection parameters:
Understand and adjust garbage collection parameters such as the size of the Young and Old Generations, thread counts, and collection intervals. This tuning can significantly impact performance.
- Minimize object creation:
Minimize unnecessary object creation to reduce the frequency of garbage collection cycles. Reuse objects when possible, and be mindful of object lifecycle management.
- Use parallelism and concurrency:
Leverage parallel and concurrent garbage collection options for improved performance. Parallel collectors can utilize multiple threads, reducing pause times.
Monitoring Java application performance with New Relic
Java garbage collection can impact the performance of your Java application, especially if you are using a garbage collector that freezes threads. Also, it’s important to understand how the garbage collection process works, and to ensure that the garbage collector knows when to remove objects from the heap. Otherwise, you can run into performance issues due to memory leaks and other problems. So how do you monitor your Java application to optimize performance and detect and triage issues?

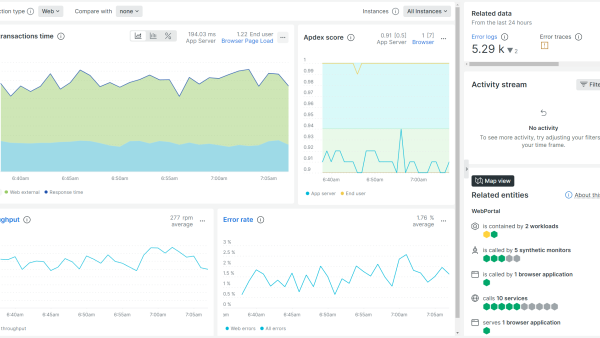
With the New Relic quickstart for Java, you can set up Java application monitoring in minutes. The quickstart includes a dashboard with visualizations that include garbage collection CPU time, CPU utilization, average physical memory, memory heap used, and average memory used. With these metrics, you can see garbage collection is impacting the performance of your application and finetune the configurations for your memory heap and garbage collector. The quickstart also includes prebuilt alerts for high CPU utilization, memory usage, transaction errors, and Apdex score, and makes it easy to alert your teams via tools like Slack and PagerDuty when issues come up.
Start monitoring your Java application today
The best way to learn more about monitoring Java applications is to get hands-on experience with an observability solution. Sign up for the forever free tier of New Relic to get started, then try out the New Relic quickstart for Java.
The views expressed on this blog are those of the author and do not necessarily reflect the views of New Relic. Any solutions offered by the author are environment-specific and not part of the commercial solutions or support offered by New Relic. Please join us exclusively at the Explorers Hub (discuss.newrelic.com) for questions and support related to this blog post. This blog may contain links to content on third-party sites. By providing such links, New Relic does not adopt, guarantee, approve or endorse the information, views or products available on such sites.


